Updated October 8, 2023
An Investor’s Guide to Understanding the Importance of Sharpe & Sortino Ratios
An Investor’s Guide to Understanding the Importance of Sharpe & Sortino Ratios
An Investor’s Guide to Understanding the Importance of Sharpe & Sortino Ratios

Mike Zaccardi, CFA, CMT
Investing Master Class
We all wish we could’ve owned shares of Apple or Amazon way back when those stocks went public decades ago. The thought of seeding just a few thousand dollars at the earliest stage of a growth stock’s life and then watching it compound to soaring heights is the lure of some investors. But there is a problem with that mindset: volatility.
Could you have stomached seeing 90% or more of your money get wiped out after the dot-com crash? Or what about 60%-plus drawdowns during the 2008 Great Financial Crisis? Indeed, riding out the ups and downs of even a diversified portfolio is no easy task. Fear often grips Wall Street and investors writ large, leading to inexperienced market participants and those without a plan to sell out at the very worst moment.
With that reality in mind, portfolio managers have two useful gauges of so-called “risk-adjusted returns.” What’s great is that these metrics are not obscure values that require a finance degree to understand. The Sharpe Ratio and Sortino Ratio are two of the most common measurements that help experts and casual investors alike determine how well a stock (or any investment) has performed over time compared to the level of risk taken. Let’s dive into these ratios so that you can understand why Allio prefers them in our portfolio assessments.

1. Sharpe Ratio
Between the two gauges of risk-adjusted returns, the Sharpe Ratio is more widely known. It was developed by William Sharpe and measures a portfolio’s return above the risk-free Treasury rate and then divides that difference by the portfolio’s standard deviation.
The higher the Sharpe Ratio, the better. A Sharpe above 0 means your portfolio’s return has been strong when compared to both what you could have earned taking no risk (in Treasury bills or cash) and how volatile your portfolio was over a given timeframe. The Sharpe Ratio is a comprehensive look at both upside and downside volatility, or the overall risk of a portfolio.
Sharpe Ratio = (Return - Risk-Free Rate) / Standard Deviation
Let's put some numbers to that. Suppose a stock returned 20% in a year while the risk-free Treasury bill rate was 5%. If the standard deviation of that stock was 40% (which is common for a single stock), then the Sharpe Ratio is calculated as:
Sharpe Ratio = (0.20 - 0.05) / 0.40 = 0.15 / 0.40 = 0.375
Therefore, the Sharpe ratio for the stock is 0.375. Not too bad. In general, a positive Sharpe ratio is what we’re looking for.
Now consider a low-risk play such as Procter & Gamble or Johnson & Johnson. We’ll say a 50/50 portfolio of those two blue chips returned 15% while the two-stock portfolio’s volatility was 8%. The risk-free rate remains at 5%. Here’s what that looks like.
Sharpe Ratio = (0.15 - 0.05) / 0.08 = 0.10 / 0.08 = 1.25
the Sharpe ratio for the portfolio is 1.25.
The higher Sharpe ratio indicates that the portfolio has a better risk-adjusted performance compared to the individual stock in the previous example. It suggests that the portfolio generated a higher return for each unit of risk taken, making it a more attractive investment option for risk-conscious investors.
The question really boils down to: Are you a risk taker or do you prefer a less volatile ride with your money? We find that most people would rather have less volatility, all else equal. Still, there are some dice-rollers out there that get their thrills from seeing wild net worth swings day by day – those are the exceptions to the norm.
2. Sortino Ratio
Let’s continue the Investment 101 crash course by dissecting the lesser-known Sortino Ratio. Developed by Frank Sortino, this risk-adjusted return valuation tool is considered the ‘Sharper’ Ratio. Here’s why: It only looks at downside risk.
After all, who cares if your portfolio is volatile if it only goes up, right? As portfolio managers, we’re all for that, but what’s concerning is when negative returns strike – like during bear markets. The Sortino ratio is calculated by subtracting the risk-free rate of return from the portfolio's average return and dividing it by the downside deviation (negative returns).
Sortino Ratio = (Return - Risk-Free Rate) / Downside Deviation
So, Sortino’s calculation only penalizes performance when it includes big losses. If you are of the risk-averse mindset, this ratio is probably what you want to look at when you review your portfolio’s performance. It’s particularly helpful to monitor the Sortino Ratio during tough times – like 2000, 2008, and 2022.
Taking our previous examples a step further, suppose the single-stock portfolio had a downside deviation of 30%:
Sortino Ratio = (0.20 - 0.05) / 0.30 = 0.15 / 0.30 = 0.5
In this instance, a Sortino Ratio of 0.5 says that the portfolio earned a higher return for each unit or downside risk compared to the risk-free rate. Since it is a positive value, performance was favorable while downside volatility was mitigated. Like the Sharpe Ratio, the higher the ratio the better.
For the P&G and J&J 50/50 portfolio, we’ll say there was a 5% downside deviation since those defensive companies tend to hold up well in downturns.
Sortino Ratio = (0.15 - 0.05) / 0.05 = 0.10 / 0.05 = 2.0
Again, the lower-returning portfolio sports a higher ratio than the single-stock risky portfolio.
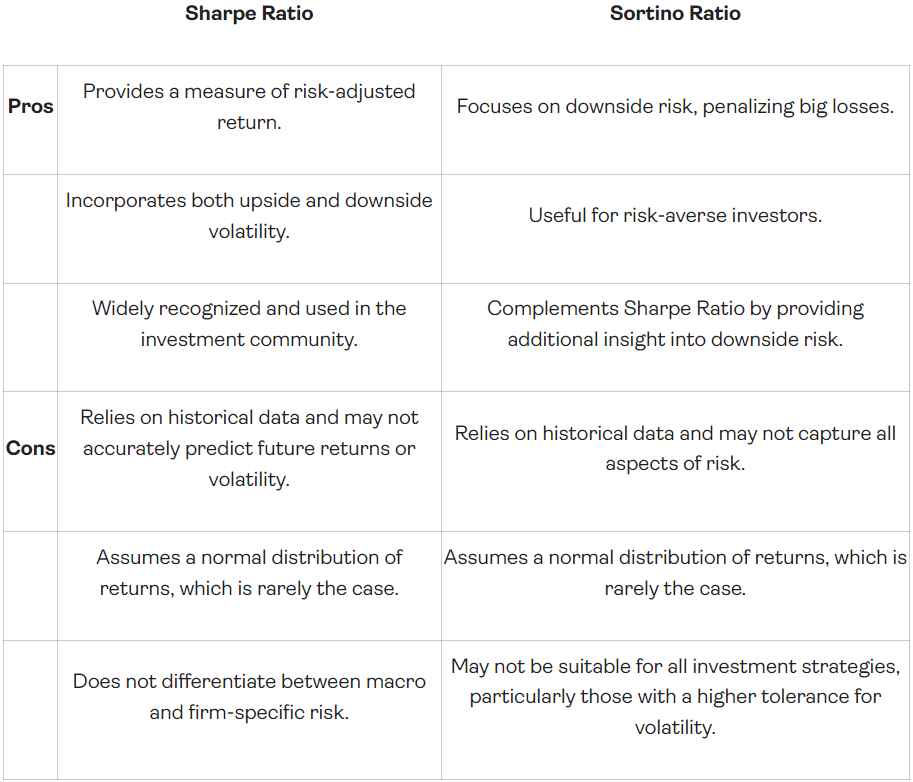
Sharpe Ratio Versus Sortino Ratio Summary, Pros & Cons

Why These Ratios Matter at Allio
The Sharpe and Sortino Ratios compare performance to volatility. They are like ‘signal-to-noise' comparisons and convey how smooth or bumpy your portfolio’s ride was over a period. Just displaying an investment’s return doesn’t tell us what it felt like on the way to achieving that performance.
Was it akin to being on an easy-going Ferris wheel (such as in a low-risk bond fund)? Or did it feel as if you were on a scary roller coaster (like in a concentrated allocation of a few volatile stocks)? Or somewhere in between? The Sharpe and Sortino Ratios give a sense of what the journey was like.
While the numbers matter, these two ratios are just as much about you as they are about the portfolio. Risk-averse investors may want to pay closer attention to the Sortino Ratio while people who don’t care a whit about volatility might prefer to disregard both metrics. At Allio, we are risk-aware managers. We believe that smoothing out returns helps investors stay in the game to achieve long-term wealth and financial freedom.
The Bottom Line
Both the Sharpe and Sortino ratios are useful risk-adjusted return metrics that offer insights into a portfolio’s performance relative to risk. While the Sharpe Ratio uses the broader standard deviation risk gauge, the Sortino Ratio focuses on just downside volatility. Both ratios put an allocation’s performance in a proper risk context. Ultimately, both measures help each investor make better decisions based on their unique risk tolerance levels.
We all wish we could’ve owned shares of Apple or Amazon way back when those stocks went public decades ago. The thought of seeding just a few thousand dollars at the earliest stage of a growth stock’s life and then watching it compound to soaring heights is the lure of some investors. But there is a problem with that mindset: volatility.
Could you have stomached seeing 90% or more of your money get wiped out after the dot-com crash? Or what about 60%-plus drawdowns during the 2008 Great Financial Crisis? Indeed, riding out the ups and downs of even a diversified portfolio is no easy task. Fear often grips Wall Street and investors writ large, leading to inexperienced market participants and those without a plan to sell out at the very worst moment.
With that reality in mind, portfolio managers have two useful gauges of so-called “risk-adjusted returns.” What’s great is that these metrics are not obscure values that require a finance degree to understand. The Sharpe Ratio and Sortino Ratio are two of the most common measurements that help experts and casual investors alike determine how well a stock (or any investment) has performed over time compared to the level of risk taken. Let’s dive into these ratios so that you can understand why Allio prefers them in our portfolio assessments.
1. Sharpe Ratio
Between the two gauges of risk-adjusted returns, the Sharpe Ratio is more widely known. It was developed by William Sharpe and measures a portfolio’s return above the risk-free Treasury rate and then divides that difference by the portfolio’s standard deviation.
The higher the Sharpe Ratio, the better. A Sharpe above 0 means your portfolio’s return has been strong when compared to both what you could have earned taking no risk (in Treasury bills or cash) and how volatile your portfolio was over a given timeframe. The Sharpe Ratio is a comprehensive look at both upside and downside volatility, or the overall risk of a portfolio.
Sharpe Ratio = (Return - Risk-Free Rate) / Standard Deviation
Let's put some numbers to that. Suppose a stock returned 20% in a year while the risk-free Treasury bill rate was 5%. If the standard deviation of that stock was 40% (which is common for a single stock), then the Sharpe Ratio is calculated as:
Sharpe Ratio = (0.20 - 0.05) / 0.40 = 0.15 / 0.40 = 0.375
Therefore, the Sharpe ratio for the stock is 0.375. Not too bad. In general, a positive Sharpe ratio is what we’re looking for.
Now consider a low-risk play such as Procter & Gamble or Johnson & Johnson. We’ll say a 50/50 portfolio of those two blue chips returned 15% while the two-stock portfolio’s volatility was 8%. The risk-free rate remains at 5%. Here’s what that looks like.
Sharpe Ratio = (0.15 - 0.05) / 0.08 = 0.10 / 0.08 = 1.25
the Sharpe ratio for the portfolio is 1.25.
The higher Sharpe ratio indicates that the portfolio has a better risk-adjusted performance compared to the individual stock in the previous example. It suggests that the portfolio generated a higher return for each unit of risk taken, making it a more attractive investment option for risk-conscious investors.
The question really boils down to: Are you a risk taker or do you prefer a less volatile ride with your money? We find that most people would rather have less volatility, all else equal. Still, there are some dice-rollers out there that get their thrills from seeing wild net worth swings day by day – those are the exceptions to the norm.
2. Sortino Ratio
Let’s continue the Investment 101 crash course by dissecting the lesser-known Sortino Ratio. Developed by Frank Sortino, this risk-adjusted return valuation tool is considered the ‘Sharper’ Ratio. Here’s why: It only looks at downside risk.
After all, who cares if your portfolio is volatile if it only goes up, right? As portfolio managers, we’re all for that, but what’s concerning is when negative returns strike – like during bear markets. The Sortino ratio is calculated by subtracting the risk-free rate of return from the portfolio's average return and dividing it by the downside deviation (negative returns).
Sortino Ratio = (Return - Risk-Free Rate) / Downside Deviation
So, Sortino’s calculation only penalizes performance when it includes big losses. If you are of the risk-averse mindset, this ratio is probably what you want to look at when you review your portfolio’s performance. It’s particularly helpful to monitor the Sortino Ratio during tough times – like 2000, 2008, and 2022.
Taking our previous examples a step further, suppose the single-stock portfolio had a downside deviation of 30%:
Sortino Ratio = (0.20 - 0.05) / 0.30 = 0.15 / 0.30 = 0.5
In this instance, a Sortino Ratio of 0.5 says that the portfolio earned a higher return for each unit or downside risk compared to the risk-free rate. Since it is a positive value, performance was favorable while downside volatility was mitigated. Like the Sharpe Ratio, the higher the ratio the better.
For the P&G and J&J 50/50 portfolio, we’ll say there was a 5% downside deviation since those defensive companies tend to hold up well in downturns.
Sortino Ratio = (0.15 - 0.05) / 0.05 = 0.10 / 0.05 = 2.0
Again, the lower-returning portfolio sports a higher ratio than the single-stock risky portfolio.
Sharpe Ratio Versus Sortino Ratio Summary, Pros & Cons
Why These Ratios Matter at Allio
The Sharpe and Sortino Ratios compare performance to volatility. They are like ‘signal-to-noise' comparisons and convey how smooth or bumpy your portfolio’s ride was over a period. Just displaying an investment’s return doesn’t tell us what it felt like on the way to achieving that performance.
Was it akin to being on an easy-going Ferris wheel (such as in a low-risk bond fund)? Or did it feel as if you were on a scary roller coaster (like in a concentrated allocation of a few volatile stocks)? Or somewhere in between? The Sharpe and Sortino Ratios give a sense of what the journey was like.
While the numbers matter, these two ratios are just as much about you as they are about the portfolio. Risk-averse investors may want to pay closer attention to the Sortino Ratio while people who don’t care a whit about volatility might prefer to disregard both metrics. At Allio, we are risk-aware managers. We believe that smoothing out returns helps investors stay in the game to achieve long-term wealth and financial freedom.
The Bottom Line
Both the Sharpe and Sortino ratios are useful risk-adjusted return metrics that offer insights into a portfolio’s performance relative to risk. While the Sharpe Ratio uses the broader standard deviation risk gauge, the Sortino Ratio focuses on just downside volatility. Both ratios put an allocation’s performance in a proper risk context. Ultimately, both measures help each investor make better decisions based on their unique risk tolerance levels.
Every Allio portfolio includes Sharpe and Sortino ratios to help you better understand your investments. Get started investing like a pro. Download Allio in the app store today!
Related Articles
Mike Zaccardi, CFA, CMT
ETF Investment Guide: Your Roadmap to Building a Diverse and Profitable Portfolio
Explore the world of ETF investing with our comprehensive guide. Learn key strategies, terms, and tax considerations for successful portfolio management.

Mike Zaccardi, CFA, CMT
CAPM Formula Explained: Navigating the Relationship Between Risk and Return
Discover the power of CAPM in investment decisions. Learn the formula, calculate expected returns, and explore alternatives in modern portfolio management.

Mike Zaccardi, CFA, CMT
How To Build Wealth with Dividend Stocks: A Complete Guide to Smart Investing
Learn how to invest in dividends – our comprehensive guide covers strategies, risks, and the key to achieving stable financial returns.

Mike Zaccardi, CFA, CMT
ETF Investment Guide: Your Roadmap to Building a Diverse and Profitable Portfolio
Explore the world of ETF investing with our comprehensive guide. Learn key strategies, terms, and tax considerations for successful portfolio management.
Mike Zaccardi, CFA, CMT
CAPM Formula Explained: Navigating the Relationship Between Risk and Return
Discover the power of CAPM in investment decisions. Learn the formula, calculate expected returns, and explore alternatives in modern portfolio management.
The articles and customer support materials available on this property by Allio are educational only and not investment or tax advice.
If not otherwise specified above, this page contains original content by Allio Advisors LLC. This content is for general informational purposes only.
The information provided should be used at your own risk.
The original content provided here by Allio should not be construed as personal financial planning, tax, or financial advice. Whether an article, FAQ, customer support collateral, or interactive calculator, all original content by Allio is only for general informational purposes.
While we do our utmost to present fair, accurate reporting and analysis, Allio offers no warranties about the accuracy or completeness of the information contained in the published articles. Please pay attention to the original publication date and last updated date of each article. Allio offers no guarantee that it will update its articles after the date they were posted with subsequent developments of any kind, including, but not limited to, any subsequent changes in the relevant laws and regulations.
Any links provided to other websites are offered as a matter of convenience and are not intended to imply that Allio or its writers endorse, sponsor, promote, and/or are affiliated with the owners of or participants in those sites, or endorses any information contained on those sites, unless expressly stated otherwise.
Allio may publish content that has been created by affiliated or unaffiliated contributors, who may include employees, other financial advisors, third-party authors who are paid a fee by Allio, or other parties. Unless otherwise noted, the content of such posts does not necessarily represent the actual views or opinions of Allio or any of its officers, directors, or employees. The opinions expressed by guest writers and/or article sources/interviewees are strictly their own and do not necessarily represent those of Allio.
For content involving investments or securities, you should know that investing in securities involves risks, and there is always the potential of losing money when you invest in securities. Before investing, consider your investment objectives and Allio's charges and expenses. Past performance does not guarantee future results, and the likelihood of investment outcomes are hypothetical in nature. This page is not an offer, solicitation of an offer, or advice to buy or sell securities in jurisdictions where Allio Advisors is not registered.
For content related to taxes, you should know that you should not rely on the information as tax advice. Articles or FAQs do not constitute a tax opinion and are not intended or written to be used, nor can they be used, by any taxpayer for the purpose of avoiding penalties that may be imposed on the taxpayer.