Updated May 30, 2023

Raymond Micaletti, Ph.D.
Alpha
The broad U.S. equity market rebounded Thursday and Friday to eke out a small weekly gain after falling Monday through Wednesday. The rebound in the latter half of the week was driven by a surge in mega-cap tech stocks on account of Nvidia’s earnings report (where the company’s second quarter revenue forecast was 50% higher than analysts’ estimates).
Accordingly, mega-cap tech and the AI narrative continue to be the market’s main attractions. The Nasdaq 100 added 3.5% last week (launching 5% from NVDA’s after-hours report on Wednesday into Friday’s close) on top of its 3.5% gain the previous week.
Its year-to-date performance relative to the S&P 500 (+19%) and the Russell 2000 (+29%) has become borderline farcical. Those types of gaps have only been seen a few times before, mainly during the dotcom bubble, around the time of the Great Financial Crisis, and in the wake of the COVID selloff.
The Nasdaq 100 has outperformed the S&P 500 from open to close on 70% of days this year. That’s a 3-sigma event and it encompasses the largest number of net daily outperformances (i.e., the number of days QQQ outperformed SPY minus the number SPY outperformed QQQ) in a 5-month stretch ever. What we are witnessing is historic.
As tech’s levitation has been driven by the AI narrative—a narrative that rests on stories of future growth and increased margins; stories that can’t be falsified at present—it’s entirely conceivable that tech’s dominance continues (until something comes along to temper the euphoria).
Interestingly, equities (and mainly tech) continue to rise despite rising interest rates. The consensus macro playbook says that when (real) rates rise, long-duration equities, such as technology stocks, falter. But that hasn’t been the case and it may provide a hint as to a potential market regime shift.
Secular regimes tend to be driven by one of two different forces–earnings growth or inflation. For example, the secular bear market from 1965 to 1982 was driven by high inflation. The secular bull market from 1982 to 2000 was driven by disinflation. The secular bear market from 2000 to 2010 was driven by low real earnings growth; the secular bull market from 2010 to 2021 was driven by high real earnings growth.
The next regime in the cycle (the cycles alternate) would be a secular bear market driven by high inflation–and what we witnessed since the COVID selloff would appear to validate that expectation. During such regimes, we would expect equities and bonds to have positive correlations, as they both rise when inflation falls, and fall when inflation rises.
Sure enough, equities and bonds have had positive correlations since April 2020. Moreover, inflation-sensitive assets (e.g., energy stocks, commodities) have outperformed.
But over the last three months, equities and bonds have had negative correlations of daily returns. Negative correlations between equities and bonds implies a regime driven by growth not inflation. I.e., when growth increases, equities rise and bonds fall; when growth decreases, equities fall and bonds rise.
Because bonds have been falling and equities rising, is the market trying to tell us that growth is going to surprise to the upside?
One of our relative sentiment indicators aggregates information on investor positioning in equities, long-duration bonds and along the yield curve. At present, institutions are relatively bullish on equities, but relatively bearish on bonds.
In an inflation-driven regime, institutions being relatively bearish on bonds would weigh on equities (because of the positive correlation between the two asset classes during such regimes). But equities are not falling and all of our other relative sentiment indicators are solidly bullish.
Thus, we might infer from both market action and investor positioning that the market is focused on growth, not inflation, and is suggesting growth is going to be stronger than anticipated.
With that potential regime shift in mind, how does the rest of the evidence shape up?
The Bull Case
The main driver here appears to be the longer-term technical backdrop as mentioned last week. Recent price action has triggered events that typically happen only during bull markets (such as remaining above the 200-day moving average for a certain number of days, not making a new 52-week low in the past seven months, etc.).
These technical milestones come in the wake of multiple breadth thrusts from earlier in the year (mid-January, late March)–each of which has tended to see solidly higher equities six to twelve months forward.
On the positioning front, relative sentiment in growth (e.g., commodities, equities) and liquidity-related assets (e.g., currencies, short-term fixed income) remains bullish for risk assets.
Notably, dollar relative sentiment remains bearish and relative sentiment in cross-asset drivers of the dollar also suggest potential headwinds for the USD. Thus, we would expect the dollar’s recent rally to run out of steam eventually, so long as that bearishness remains.
From a market logic perspective, the S&P 500 has spent most of the past four months trading between 4100 and 4200. That range has been thoroughly mined. It would make sense now for it to test its August high (the Nasdaq surpassed its August high two weeks ago).
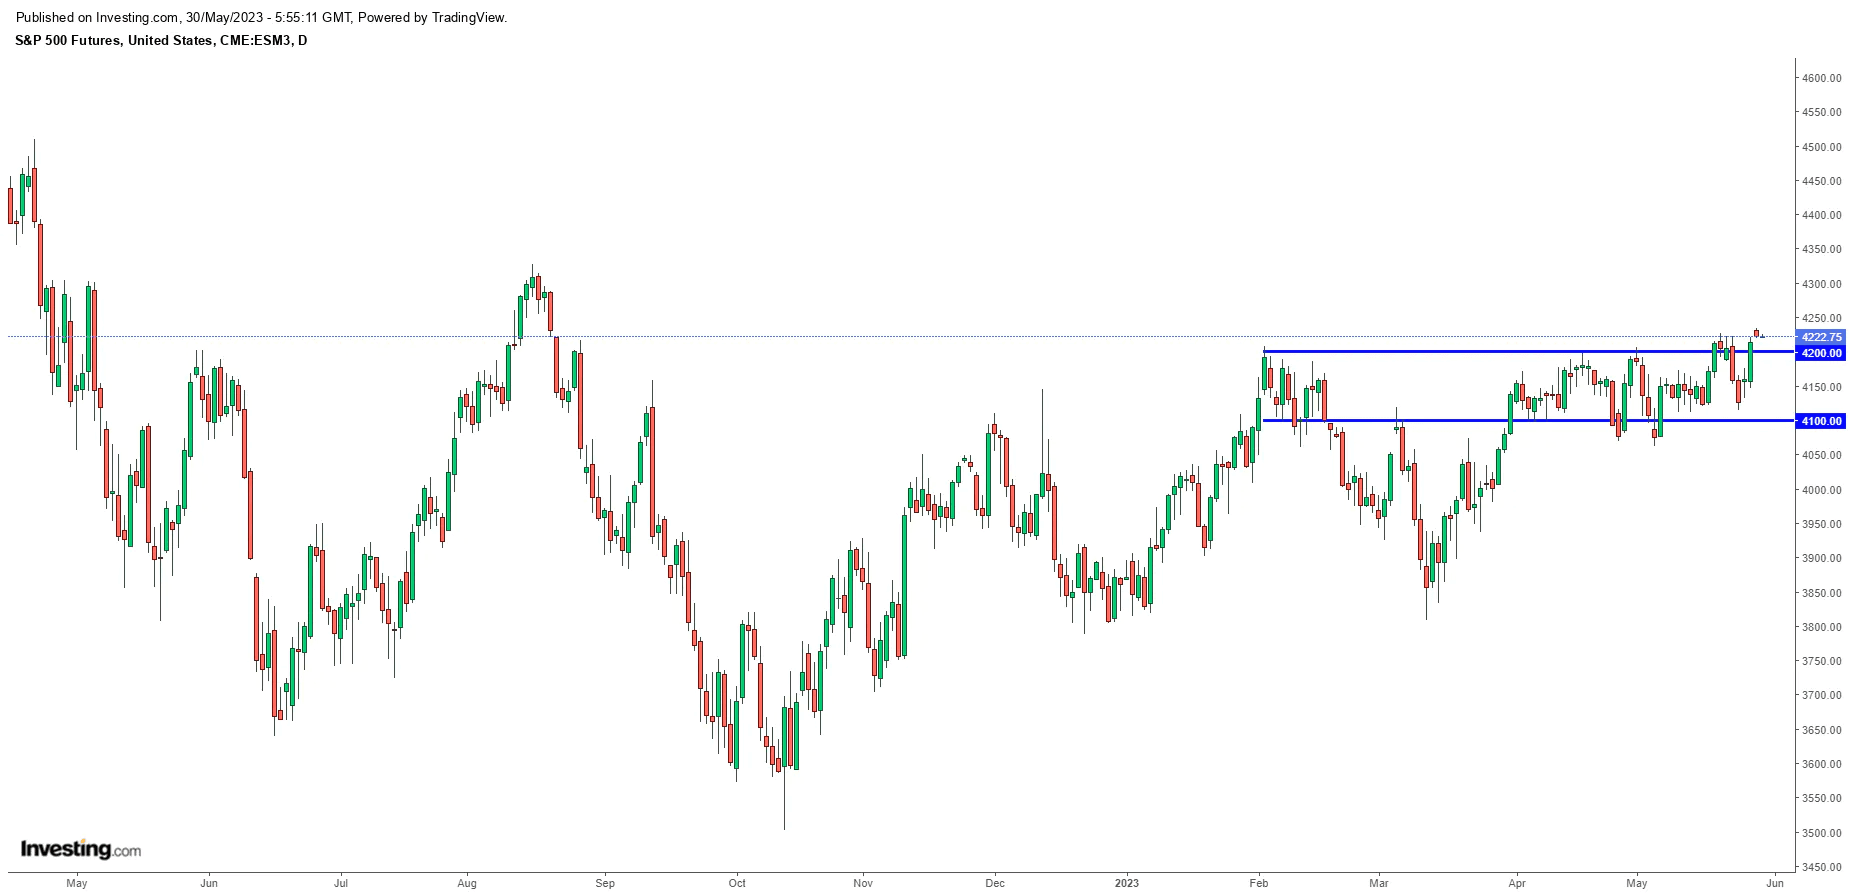
Source: Investing.com
Apple continues to hold above its bull-flag breakout on the weekly chart. If Apple gets in gear to the upside, the recent Nasdaq outperformance may end up seeming quaint. Notably, Apple’s Worldwide Developers Conference runs from June 5th to June 9th, which may provide a catalyst for further appreciation.
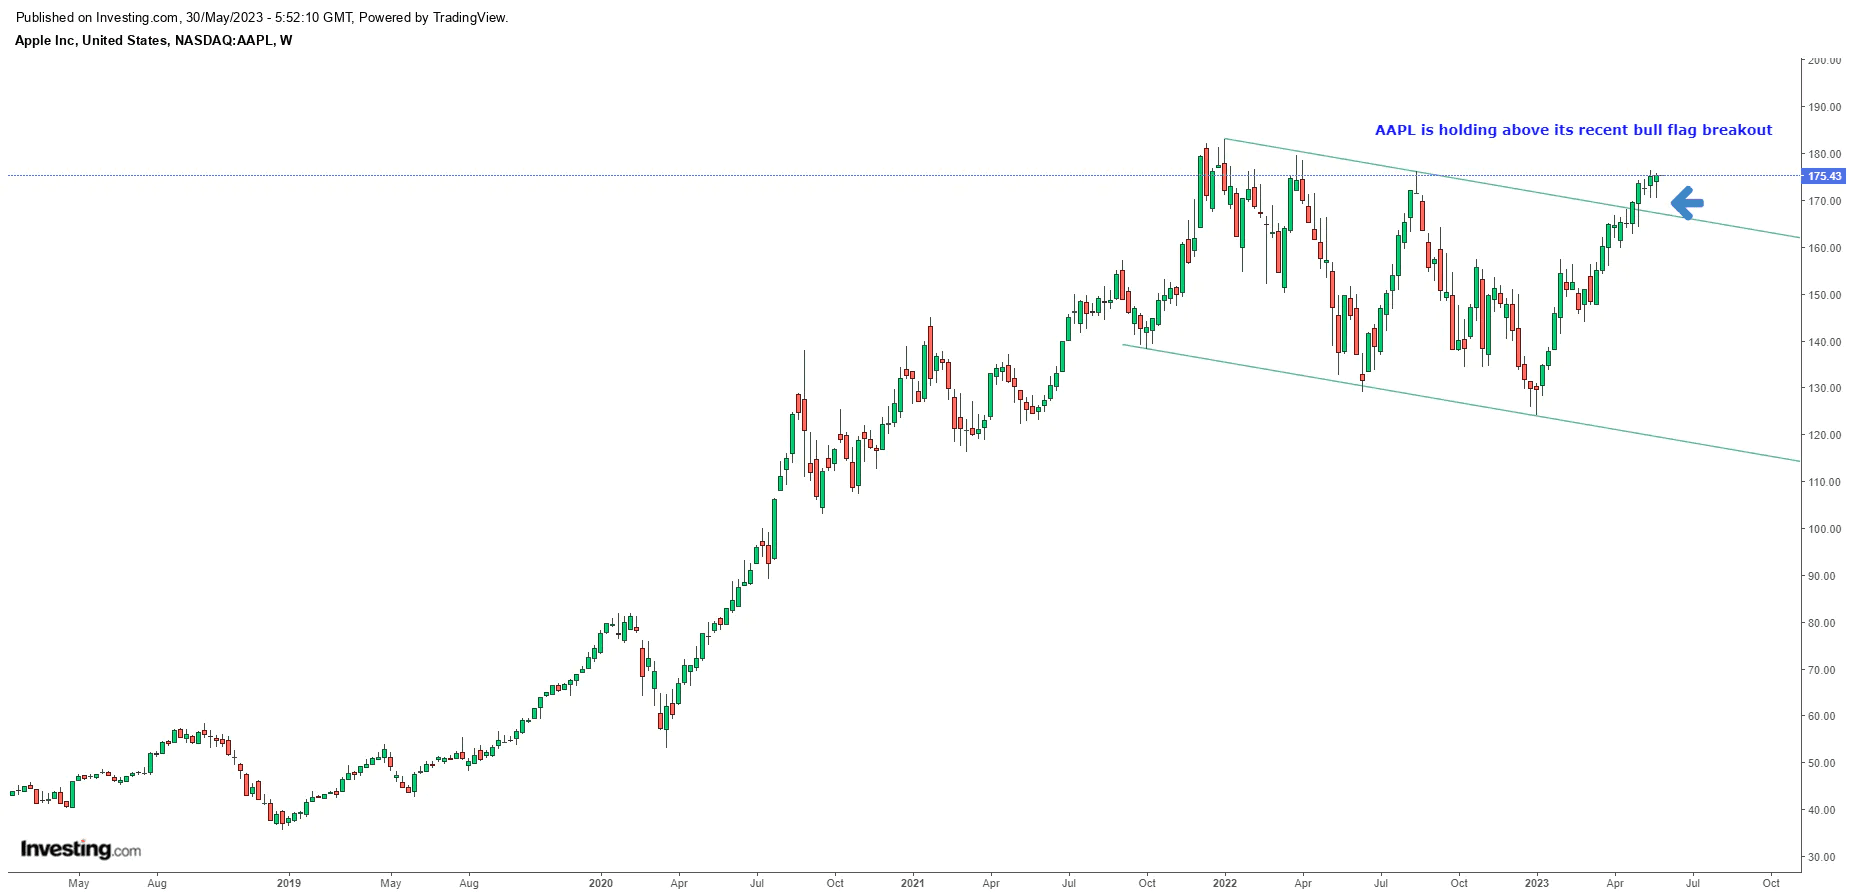
Source: Investing.com
The Bear Case
The bear case rests on the likelihood the market is getting way ahead of itself with its forecasts for AI.
For example, NVDA is trading somewhere around 35x sales. If its stock price were held constant, it would have to deliver 30% annualized revenue growth over the next decade to end up trading at 3x sales. While such growth may be possible, to us it appears highly unlikely in a competitive world for a company that is already a behemoth.
Our preferred indicator for forward U.S. equity returns ticked down last week to 3% (nominal) annualized over the next decade. That is 80 bps below where the 10-year yield closed the week. Thus, it’s reasonable to expect 10-year bonds to outperform broad U.S. equities over the next decade.
On its recent rise, the Nasdaq has left several price gaps below. Those gaps tend to get filled, so it is likely we revisit those price levels at some point. Moreover, the Nasdaq 100 (QQQ) is butting up against the 61.8% Fibonacci retracement level of its fall from its all-time (closing) high of 405 (in 2021) to its 2022 (closing) low of 260. In both 2000 and 2008, the Nasdaq was rejected at that Fibonacci level and its bear market rallies were halted–something to keep an eye on here.
In the short-term, the market, particularly tech, is markedly overbought and due for at least a modest pullback.
And don’t forget the remnant bank crisis, which may become inflamed again as interest rates move higher. The reduction of credit in the economy might eventually take its toll.
Our View
We are finally seeing some of the narrative-shift (from “the world is ending” to “AI will save the world”) and equity squeeze that we had been expecting in March and April.
Speculators, who had been fighting the Nasdaq rally all year, have finally turned bullish on the Nasdaq relative to institutions (but are still relatively bearish on the S&P 500).
Earlier in the month, we mentioned that investor positioning could turn bearish for equities by the end of the month. Indeed, if the paradigm of positive correlations between equities and bonds were still in effect (which we believed to be the case when we wrote that at the beginning of May), equity relative sentiment would take a notable turn lower next week (from near 80% to near 50%).
But as discussed earlier, over the last three months, equity-bond correlations have been negative–suggestive of a (cyclical) growth-driven regime. And all of our other relative sentiment indicators, both direct and cross-asset, are bullish for equities.
While the market is pricing in another Fed rate hike in June and the conventional wisdom is that rate hikes will slow the economy and market, we have heard heterodox opinions that assert the opposite: That with our current level of debt, higher interest rates lead to higher interest expenses paid into the economy, which act as a stimulus on the order of a round of the Fed’s quantitative easing.
Bolstering that claim is the fact that despite having been hearing about an impending recession for over a year, it hasn’t happened yet and growth seems to be coming in reasonably well (not too hot, not too cold). Further bolstering that claim is that equities are seemingly unfazed by the recent rise in interest rates.
Thus, in our view, equities are likely to continue higher over the intermediate-term, short-term pullbacks notwithstanding.
Equity relative sentiment remains marginally bullish even if the true correlation between equities and bonds is still positive. And if a correlation regime-shift has occurred, relative sentiment would be strongly bullish. Bullish relative sentiment coupled with positive equity-market momentum tends to produce decent annualized returns.
Further, when one considers that the level of euphoria we have observed in the Nasdaq doesn’t tend to evaporate overnight and retail investors haven’t properly joined the party, it’s possible we might be closer to the beginning of this rally than the end–a sobering thought.
Ultimately, we believe the stories fueling this AI narrative will turn out to be fairytales, inflation will reclaim center stage, and equities will suffer. But positioning and price action suggest we are not at that point just yet.
Allio Portfolio Updates
No change to Allio’s portfolio last week. We maintain a strategic position aligned with our view of the secular macro regime and a tactical position that favors the Nasdaq 100.
Want access to your own expert-managed investment portfolio? Download Allio in the app store today!
Related Articles
The articles and customer support materials available on this property by Allio are educational only and not investment or tax advice.
If not otherwise specified above, this page contains original content by Allio Advisors LLC. This content is for general informational purposes only.
The information provided should be used at your own risk.
The original content provided here by Allio should not be construed as personal financial planning, tax, or financial advice. Whether an article, FAQ, customer support collateral, or interactive calculator, all original content by Allio is only for general informational purposes.
While we do our utmost to present fair, accurate reporting and analysis, Allio offers no warranties about the accuracy or completeness of the information contained in the published articles. Please pay attention to the original publication date and last updated date of each article. Allio offers no guarantee that it will update its articles after the date they were posted with subsequent developments of any kind, including, but not limited to, any subsequent changes in the relevant laws and regulations.
Any links provided to other websites are offered as a matter of convenience and are not intended to imply that Allio or its writers endorse, sponsor, promote, and/or are affiliated with the owners of or participants in those sites, or endorses any information contained on those sites, unless expressly stated otherwise.
Allio may publish content that has been created by affiliated or unaffiliated contributors, who may include employees, other financial advisors, third-party authors who are paid a fee by Allio, or other parties. Unless otherwise noted, the content of such posts does not necessarily represent the actual views or opinions of Allio or any of its officers, directors, or employees. The opinions expressed by guest writers and/or article sources/interviewees are strictly their own and do not necessarily represent those of Allio.
For content involving investments or securities, you should know that investing in securities involves risks, and there is always the potential of losing money when you invest in securities. Before investing, consider your investment objectives and Allio's charges and expenses. Past performance does not guarantee future results, and the likelihood of investment outcomes are hypothetical in nature. This page is not an offer, solicitation of an offer, or advice to buy or sell securities in jurisdictions where Allio Advisors is not registered.
For content related to taxes, you should know that you should not rely on the information as tax advice. Articles or FAQs do not constitute a tax opinion and are not intended or written to be used, nor can they be used, by any taxpayer for the purpose of avoiding penalties that may be imposed on the taxpayer.