Updated June 19, 2023

Bill Chen, CFA
Personal Finance
The first few months of 2022 have been a volatile period for the stock market.
Between December 31, 2021 and March 14, 2022 (when the realities of Russia’s invasion of Ukraine became apparent), the three major US stock indexes shed quite a bit of value, with both the S&P 500 and NASDAQ officially entering correction territory (and the Dow Jones coming close):
S&P 500: -12.44%
NASDAQ: -19.58%
Dow Jones: -9.34%
Additionally, many tech stocks have seen their share prices come down even more dramatically from the highs they saw early on during the pandemic. Zoom, Teladoc, Spotify, and Shopify shares are each down 80%, 77%, 61%, and 64%, respectively, from their all-time highs.
Many investors—especially younger investors, who have never lived through volatile market periods like this one—have begun panicking. What the heck is going on?
While nobody likes to be on the receiving end of losses, investors can at least take solace in knowing that this isn’t abnormal. The market regularly moves in cycles which include both price appreciation and depreciation. Understanding this fact, and how market cycles operate, is key to helping you construct a portfolio that is resilient despite the current market environment.
Below, we define the different stages of market cycles and take a closer look at the current market environment we find ourselves in.

Understanding Market Cycles
Market cycles can last anywhere from a few weeks or months to multiple years. Regardless of how long they last, all market cycles consist of the following four phases:
Accumulation Phase: The accumulation phase occurs when the market has formed a bottom after the previous cycle. During this phase, valuations are typically contracted and some investors begin to buy assets that they view as being attractively priced.
Mark-Up Phase: During the mark-up phase, the market has stabilized. This leads more investors to reenter the market, driving up prices. The late stages of this phase tend to be driven more by greed than by sound fundamentals. This phase typically marks the market top for the cycle.
Distribution Phase: During the distribution phase, bullish sentiment turns mixed as more sellers emerge. At this time, buyers and sellers fight for dominance, and the market will often trade sideways within a band.
Mark-Down Phase: The mark-down phase sees sellers more aggressive than buyers, which drives prices lower. Eventually, a new bottom will be formed, and the market will move into its next cycle with the beginning of the next accumulation phase.
The best time to purchase assets would naturally be during the accumulation phase, when valuations have contracted and the market has seemingly formed a bottom. Of course, it’s incredibly difficult to time the market, and a cycle can quickly move between phases. That’s why everyday investors are typically encouraged to invest on a recurring schedule (known as dollar-cost averaging) regardless of the market cycle they find themselves in, as opposed to trying to pick the market’s bottom before getting in.
Today’s Market Environment
The market that we find ourselves in right now has been driven by a number of different factors, including:
Record Valuations
When stocks reach valuations that are far above their historical average, it isn’t uncommon for prices to readjust downward toward the mean as investors seek to realize some gains and redeploy capital into less expensive pockets of the market. It just so happens that in December 2021, valuations for the S&P 500 were, as a whole, at levels not seen since the Dot Com Bubble back in 2000 (which were the all-time high valuations).
There are many different metrics that may be used to value companies, but one of the most popular and important is the Shiller PE Ratio. This metric is used to communicate how expensive a company is compared to its current earnings. The lower the figure, the less expensive a company is considered to be; the higher the ratio, the more expensive.
Shiller PE Ratio0510152025303540Price to earnings ratio190019502000Year
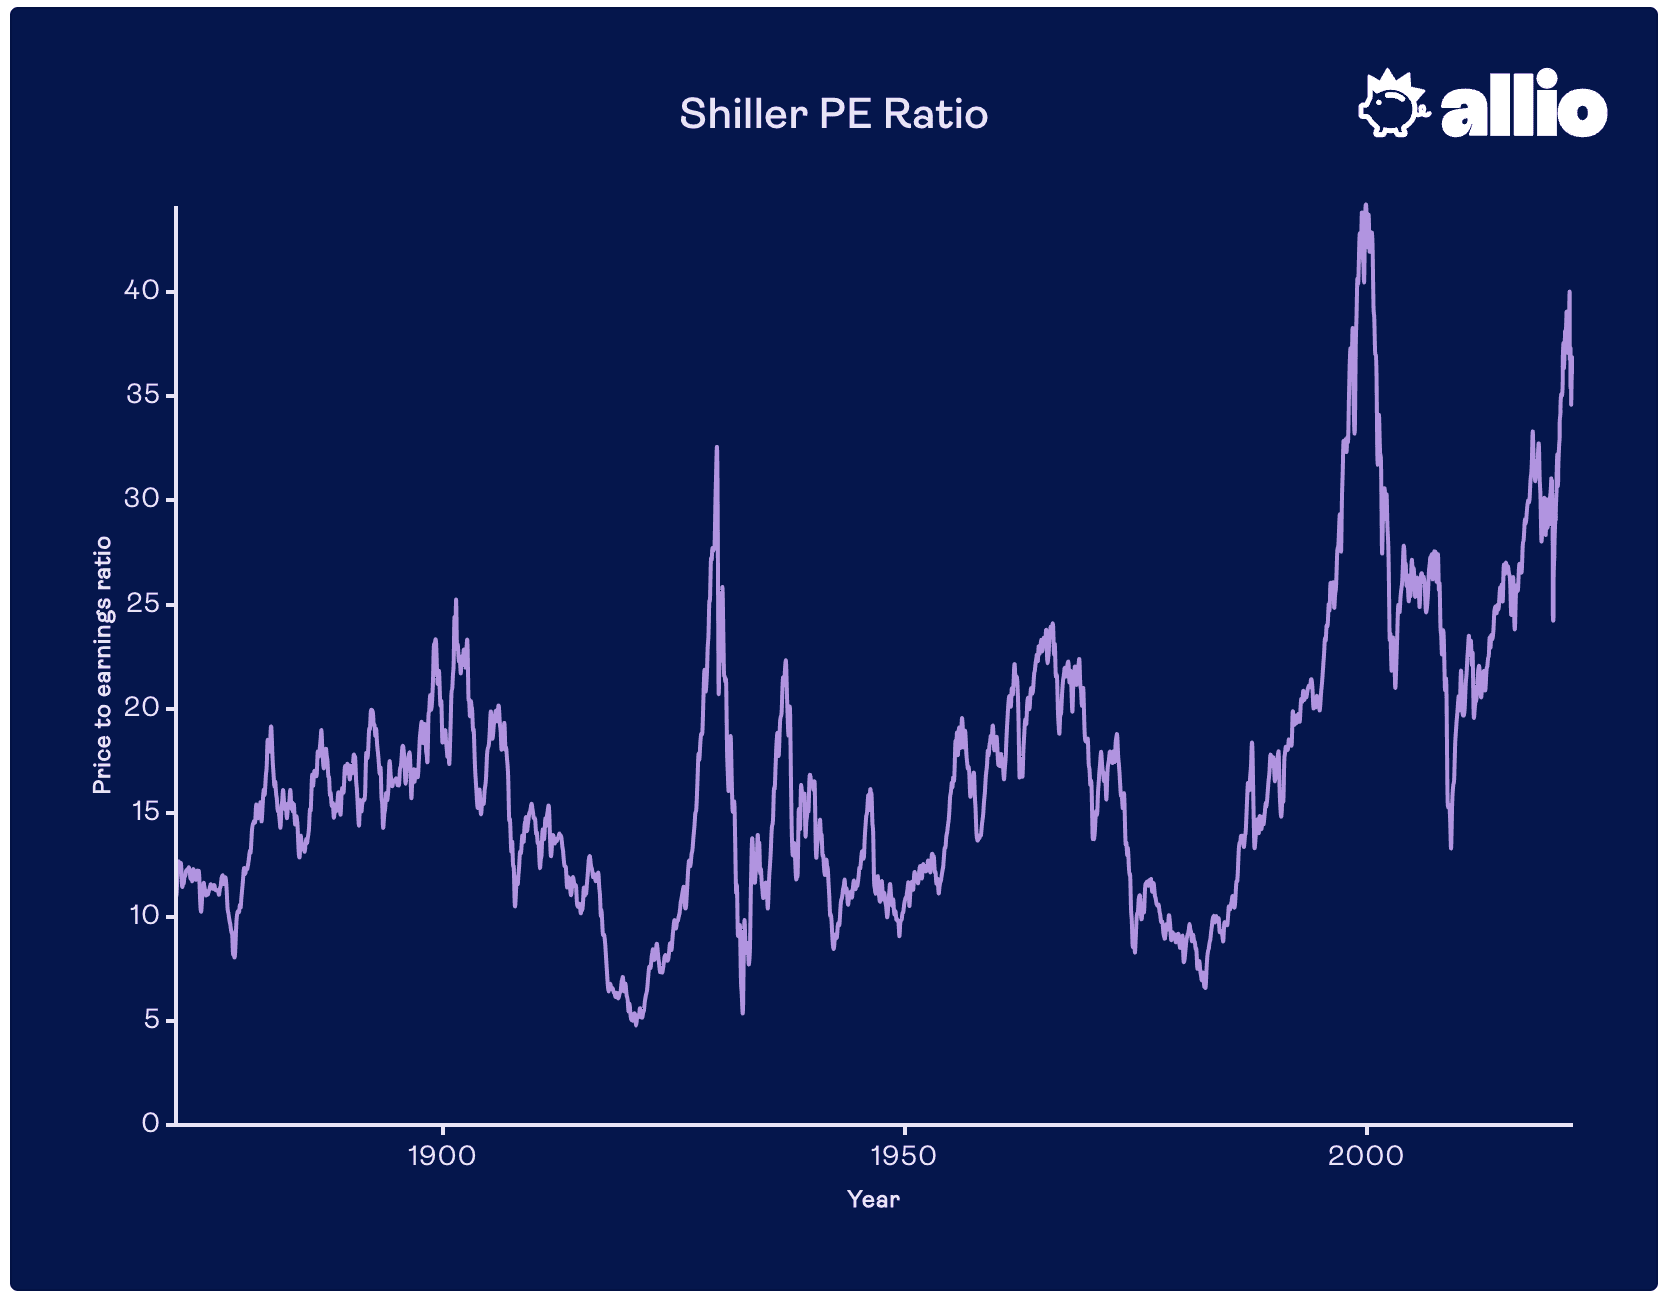
The chart above shows the monthly Shiller PE Ratio for the S&P 500. As we can see, in December 2021, the Shiller PE Ratio reached 38.25—a number not seen since the height of the Dot Com Bubble.
Tough Comparisons
Companies in certain industries, such as travel and hospitality, saw key growth metrics decelerate or decrease—dramatically so—throughout the early months of the pandemic in 2020 as people found themselves locked down and stuck inside in the name of social distancing.
But certain companies, such as those operating in the technology sector, experienced the opposite effect as consumers spent more and more time online and engaging with technology. For these businesses, key growth metrics such as revenue, number of users, and ARPU (i.e., average revenue per user) increased dramatically when compared to pre-pandemic figures, which attracted many investors who were excited by such dramatic growth.
Unfortunately, for many companies, this pandemic-fueled growth was hard to sustain or replicate, leading to very difficult comparisons in following quarters which may have given the impression that growth was slowing, stalling, or even reversing.
Rising Inflation, Tighter Monetary Policy & Fears of Recession
March 2022 saw consumer prices rise by 8.5% year over year—the fastest rate of inflation we’ve seen in the United States in 40 years. This has been driven by a variety of factors, including a tight job market, rising wages, still-disrupted supply chains, and the Russia-Ukraine War (which we discuss in more detail below).
The threat of rising inflation and an overheating economy has forced the Federal Reserve to pursue tighter monetary policy. In March 2022, the Fed raised the federal funds rate by 25 basis points, the first time rates have been raised since 2018.
This brings the federal funds rate to a range between 0.25% and 0.5% as of March 2022, and it is widely expected that the Fed will continue to raise rates throughout the year. A recent Reuters poll of more than 100 economists, shows that many experts expect the federal funds rate will reach between 1.25% and 1.5% by the Fed’s June meeting and between 2.0% and 2.25% by the end of the year.
Inflation and rising interest rates drag down stocks for a number of reasons. First, inflation has the effect of making future growth less valuable. Second, rising interest rates makes growth more expensive, especially for companies dependent on debt for said growth. And third, it has stirred up fears that there may be a recession around the corner.
According to a recent survey of economists conducted by the Wall Street Journal, the odds of the US entering a recession in the next 12 months stands at 28%, compared to just 13% the year before. These fears are largely tied to inflation, as investors try to predict what actions the Fed will take to rein it in and how those actions may slow down the economy.
Rotation from Growth to Value Stocks
Growth stocks had themselves a bit of a moment in 2020 and early 2021, as investors flocked to what were seen as high-growth names—particularly tech stocks and “pandemic plays” that were expected to benefit from the emergence of COVID. The result was skyrocketing valuations for many growth stocks, especially as FOMO drove more and more investors into those names.
But for many reasons, including those discussed above, this trend has reversed as many investors have begun to rotate out of growth stocks and into value stocks seen as underpriced.
This rotation has led to mixed results for investors. Those who were heavily invested in growth stocks, have (generally) seen the value of their position slashed. Meanwhile, those who accumulated positions in value stocks have seen the value of their positions rise—especially for stocks seen to benefit from inflation, such as many of those in the energy and consumer staples sectors.
Geopolitical Uncertainties
The current geopolitical situation occurring in Europe has led to increased volatility for stock markets around the world, including in the US.
Why?
The first reason is sanctions. In a show of support for Ukraine, many countries (including the US and most of Europe) have banded together and used sanctions in an attempt to damage the Russian economy.
Russia has been kicked out of SWIFT, the global financial messaging system that the world’s banks depend on for global operations, and the country’s oil exports have been banned in the US and UK. Additionally, many multinational businesses have decided to cease operations on Russian soil.
These sanctions have had an effect not just on shares of Russian companies, but also on those in the US.
But beyond this, the Russia-Ukraine War has threatened global supply chains and has caused many investors to reconsider the threat that war poses to the global economy. As the possibility of a prolonged war grows, some financial professionals, including those at the International Monetary Fund, worry that it will take a lasting toll on the world’s economic well-being.
Positioning Yourself for Any Market Cycle
Knowing that the market moves in cycles, and that it is difficult to predict exactly when and how these cycles will begin and end, there are steps that you can take to position your portfolio for a wide swath of realities.
1. Embrace diversification.
Different asset classes perform differently depending on the market cycle that we find ourselves in, so it’s important to ensure that you are properly diversified across and within multiple asset classes.
In addition to the domestic stocks and bonds that most people think of, international equities, commodities, real estate, and even digital assets can all help make for a more resilient portfolio.
2. Consider strategic asset allocation with a macro perspective.
Investors with a deep understanding of economic cycles may be able to use that understanding to position their portfolios to take advantage of emerging macroeconomic conditions. This investment style, known as strategic asset allocation, is often employed by hedge funds and sophisticated wealth management firms.
3. Take a long-term approach.
Finally, it’s important to remember that investing should be a long-term endeavor, especially for a younger investor with a decades-long investment horizon. Over the very long term, the market has historically trended up, despite the short-term machinations of individual market cycles.
Starting to invest as early as possible gives your money more time in the market, where it can compound and grow; dollar-cost averaging by investing consistently over the long term allows you to reduce the risk that you have bought in at all-time highs, and potentially reduces your portfolio’s volatility.
Here at Allio, we want to empower our clients to save and invest throughout both calm and turbulent markets. Our portfolios are expertly designed and strategically positioned to be diversified across multiple asset classes, including stocks, bonds, real estate, commodities, and more. Tools such as round-ups and recurring investments give our clients the power to invest on a consistent basis in order to dollar-cost average over time.
Whether you’re seeking an expert team to manage your money or looking to build your own portfolios with the best financial technology available, Allio can help. Head to the app store and download Allio today!
Related Articles


The articles and customer support materials available on this property by Allio are educational only and not investment or tax advice.
If not otherwise specified above, this page contains original content by Allio Advisors LLC. This content is for general informational purposes only.
The information provided should be used at your own risk.
The original content provided here by Allio should not be construed as personal financial planning, tax, or financial advice. Whether an article, FAQ, customer support collateral, or interactive calculator, all original content by Allio is only for general informational purposes.
While we do our utmost to present fair, accurate reporting and analysis, Allio offers no warranties about the accuracy or completeness of the information contained in the published articles. Please pay attention to the original publication date and last updated date of each article. Allio offers no guarantee that it will update its articles after the date they were posted with subsequent developments of any kind, including, but not limited to, any subsequent changes in the relevant laws and regulations.
Any links provided to other websites are offered as a matter of convenience and are not intended to imply that Allio or its writers endorse, sponsor, promote, and/or are affiliated with the owners of or participants in those sites, or endorses any information contained on those sites, unless expressly stated otherwise.
Allio may publish content that has been created by affiliated or unaffiliated contributors, who may include employees, other financial advisors, third-party authors who are paid a fee by Allio, or other parties. Unless otherwise noted, the content of such posts does not necessarily represent the actual views or opinions of Allio or any of its officers, directors, or employees. The opinions expressed by guest writers and/or article sources/interviewees are strictly their own and do not necessarily represent those of Allio.
For content involving investments or securities, you should know that investing in securities involves risks, and there is always the potential of losing money when you invest in securities. Before investing, consider your investment objectives and Allio's charges and expenses. Past performance does not guarantee future results, and the likelihood of investment outcomes are hypothetical in nature. This page is not an offer, solicitation of an offer, or advice to buy or sell securities in jurisdictions where Allio Advisors is not registered.
For content related to taxes, you should know that you should not rely on the information as tax advice. Articles or FAQs do not constitute a tax opinion and are not intended or written to be used, nor can they be used, by any taxpayer for the purpose of avoiding penalties that may be imposed on the taxpayer.