Updated April 8, 2024

Mike Zaccardi, CFA, CMT
Macro Money Monitor
Market Update
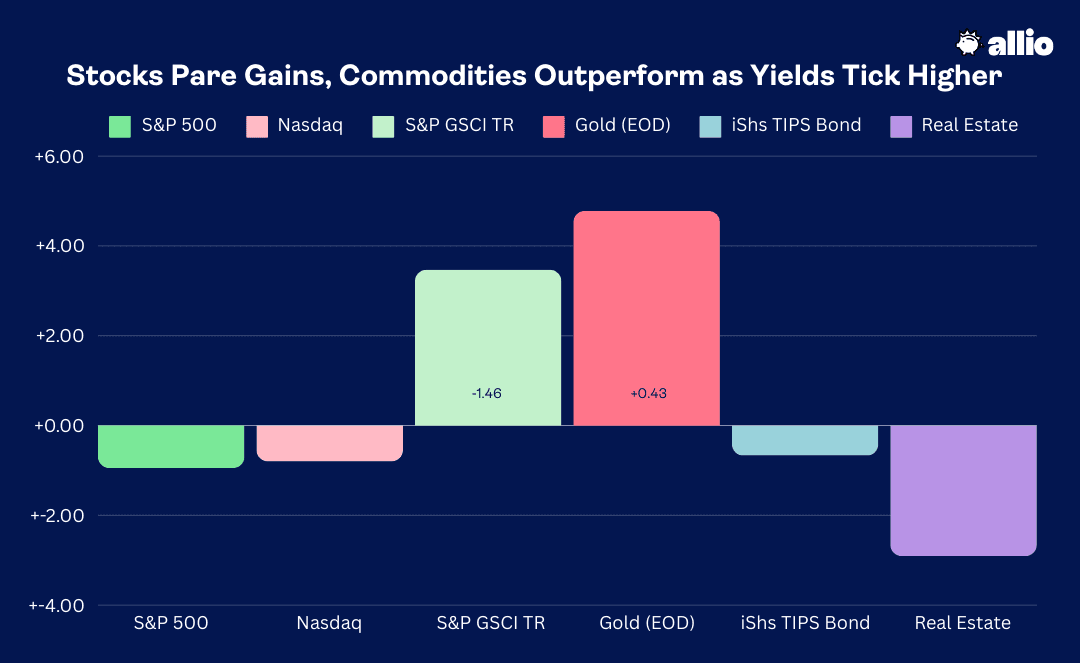
Stocks gave back a small amount of ground last week as volatility perked up around hawkish Fed Speak and rising geopolitical tensions in the Middle East. The S&P 500 shed less than 1%, and losses would have been greater had it not been for a snapback after the March jobs report last Friday. The Nasdaq Composite also sported a small loss, though the Communication Services sector finished 1% in the black. The best-performing sector was by far Energy.
The oil & gas space continues to benefit from rising commodity prices coupled with cheap equity valuations. Shares of ExxonMobil (XOM), the largest stock in the group, settled last week at an all-time high while the XLE sector ETF finally eclipsed its 2014 peak. Some rate-sensitive areas struggled, including the Real Estate sector – REITs themselves finished the first week of the new quarter at a year-to-date low.
Elsewhere, small and mid-caps generally underperformed care of higher yields. It was the same old story of stronger economic growth data leading to Treasury selling, resulting in debt-dependent areas lagging. Foreign ETFs performed about on par with the SPX, but the emerging markets area was a standout, posting a positive gain for the week.
Gold continues to work. The precious metal closed near $2330 per ounce – yet another all-time high as central banks around the world keep pressing the buy button. WTI and Brent also advanced. Now at their best marks since October last year, there’s growing chatter that more costly oil could put upside pressure on inflation over the months ahead. Finally, in the fixed-income space, the US 10-year Treasury note yield ended the week at 4.4%, the highest since November 2023 amid a better economic outlook.
For the year, the S&P 500 is up 9.1% and the Nasdaq Composite is higher by 8.2%.
Source: Stockcharts.com
The Look Ahead
After solid PMI data last week and a strong March payrolls report, this week is all about inflation. The data deck is light on Monday and Tuesday – the NY Fed will release its March Consumer Inflation Expectations survey on Monday at 10 a.m. ET. Forecast to hold steady at 3% from February, at three-year lows, the big question will be if rising gas prices cause folks to foresee bigger inflation down the road. Tuesday’s highlight is the March NFIB Small Business Optimism Index, expected to inch up to 90 from February’s 89.4 mark (which was the lowest in nine months). How small business operators view inflation and the labor market in the quarters ahead could move markets.
The major action begins on Wednesday. March CPI data hits the tape in the pre-market, and the consensus forecast calls for a 0.4% rise in Headline CPI with a 0.3% Core increase, bringing year-on-year rates to 3.5% and 3.7%, respectively. The SPX has been volatile in the wake of recent CPI days, so traders will be anxious immediately before the release. That afternoon, minutes from the March FOMC meeting are released – that will be interesting since the tone of Fed speakers recently has underscored their need to see improved inflation data before the first rate cut can come about. We’ll see what the group discussed at the previous meeting considering that the market viewed Fed’s decision and dot plots updates as dovish.
Initial Jobless Claims printed 221,000 last week, in line with recent trends. We will get the usual claims update at the same time PPI comes out on Thursday at 8:30 a.m. The PPI has been just about as important at CPI lately as its data feeds into the PCE rate, the Fed’s preferred inflation gauge. A modest 0.3% Headline increase with a 0.2% rise in the Core rate is the consensus. Import prices offer further clues on the inflation on Friday while the preliminary University of Michigan Surveys of Consumers is yet another perspective on economic expectations and inflation among households.
On the Fed speaking circuit, Kashkari participates in a town hall meeting Monday night and Goolsbee speaks in a panel discussion Tuesday at lunchtime. Williams, Collins, Bostic, and Daly have engagements on Thursday and Friday. Also be on the lookout for volatility overseas Thursday morning when the ECB holds its interest rate policy meeting.
All About Inflation: NY Fed Expectations, NFIB, CPI, PPI, UMich Reports on Tap
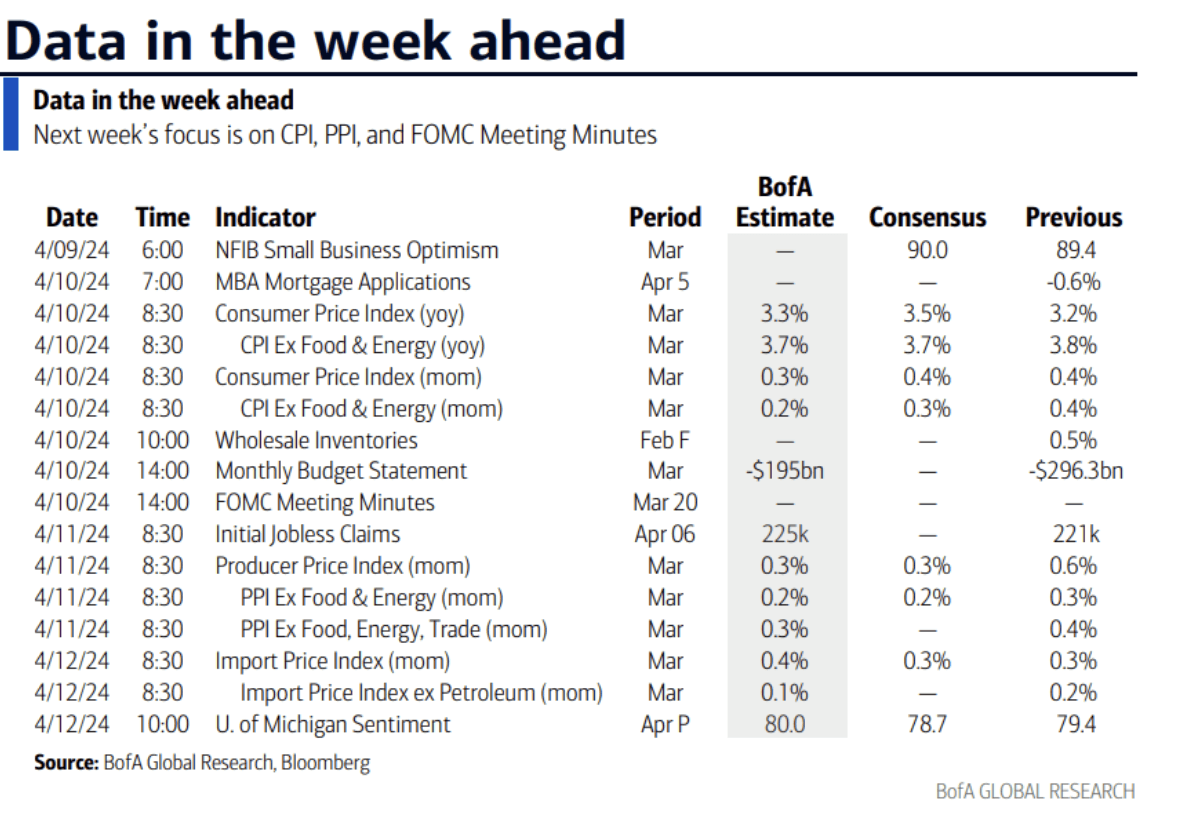
Source: Bank of America Global Research
Earnings Reports This Week
It might feel like Q4 earnings season just finished, but all eyes are now on first-quarter financials. Big banks kick things off on Friday as JPMorgan (JPM), Wells Fargo (WFC), and Citigroup (C) serve up numbers. Before the 12th, though, we’ll get an idea of how the first three months of 2024 fared in other industries. The pot space will be lit Tuesday morning when Tilray (TLRY) reports. More important to the macro, Delta’s (DAL) earnings figures and commentary on the state of leisure and business travel will be key. Then on Thursday, Constellation Brands (STZ) in the Consumer Staples sector provides another view on household consumption trends.
After CPI and PPI data, investors will turn their eyes to the Financials sector Friday before the bell. How earnings verify early in the reporting period will shed light on just how well firms were able to translate decent GDP growth trends into real cash flow and EPS. As it stands, a 3.2% earnings growth rate is seen, which would be the third straight quarter of bottom-line growth. Executives have attempted to lower the bar – for this earnings season, 79 S&P 500 companies have issued negative EPS guidance compared to just 33 companies posting positive preliminaries. Still, estimates for full-year per-share operating profits are trending better than the historical average.
Earnings Season Unofficially Begins on Friday When the Big Banks Post Q1 Results
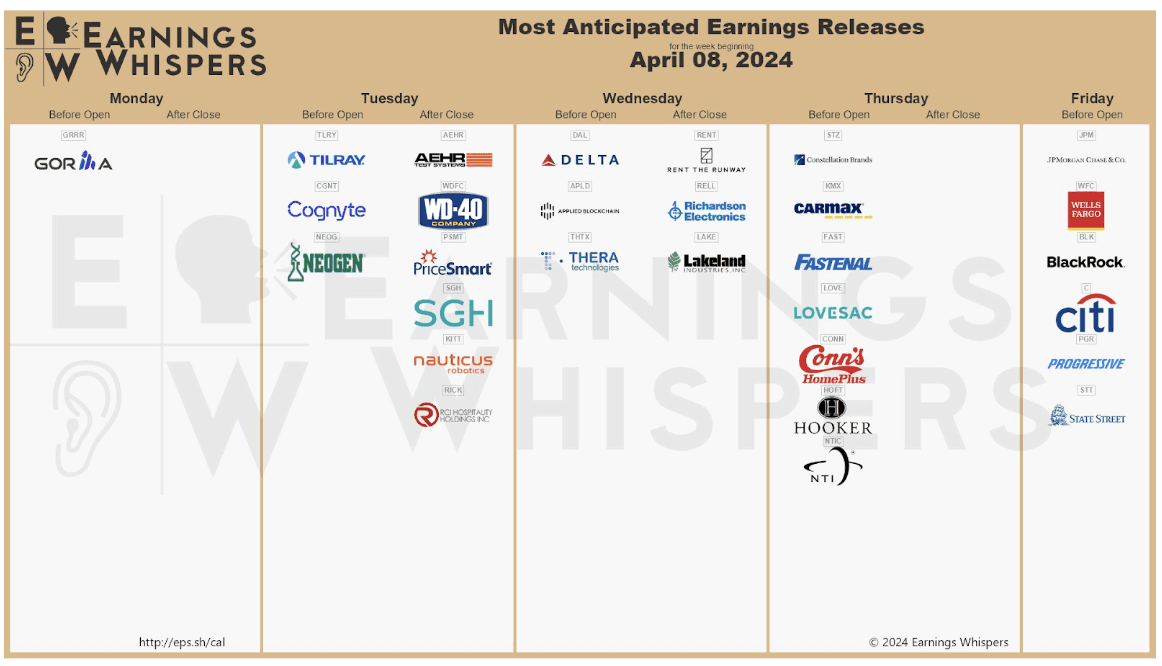
Source: Earnings Whispers
Topic of the Week: Growth Optimism Eclipses Fed Fears
Heads it’s bullish, tails it’s bullish. That is the emerging macro theme when it comes to growth and inflation data. On the one hand, better-than-expected economic indicators result in a healthier growth outlook, but also firmer inflation. For the most part in 2024, investors are willing to accept the trade-off of a stronger macro backdrop even if it means fewer Fed rate cuts. Then, when data misses the mark, the mantra is, “Well, the Fed can now begin easing monetary policy sooner.” Big picture, long-term investors should prefer the latter situation of continued above-trend economic expansion with Fed policy in restrictive mode.
Help Wanted (Still)
Case-in-point was the reaction to last Friday’s March employment report. The headline payrolls gain of 303,000, the best in 10 months, soared past economists’ expectations while workers’ earnings data was about on par with estimates. The unemployment rate fell a tick to 3.8% while the U-6 underemployment rate was steady at 7.3%. Earlier in the week, the ADP Private Payrolls report suggested that hiring activity was robust last month, and the four-week moving average of Initial Jobless Claims further underscores some tightness in the labor market.
Monthly Job Growth Picks Up Steam
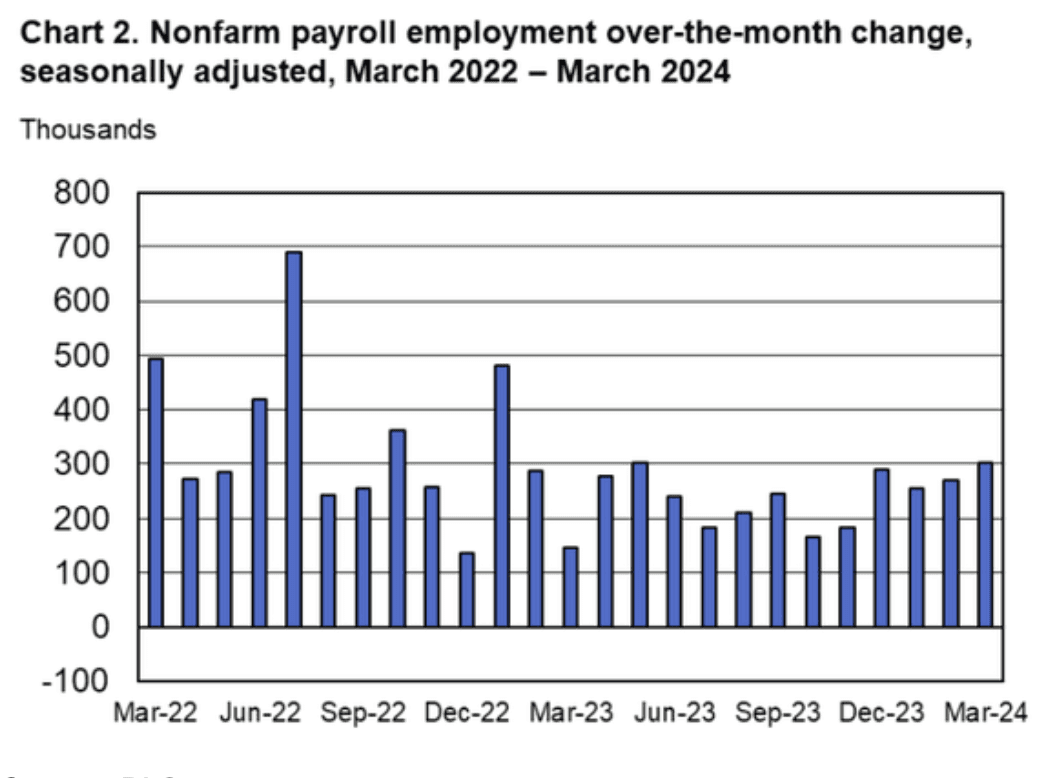
Source: BLS
Net US Immigration Soared in 2023, Helping to Boost Hiring Activity
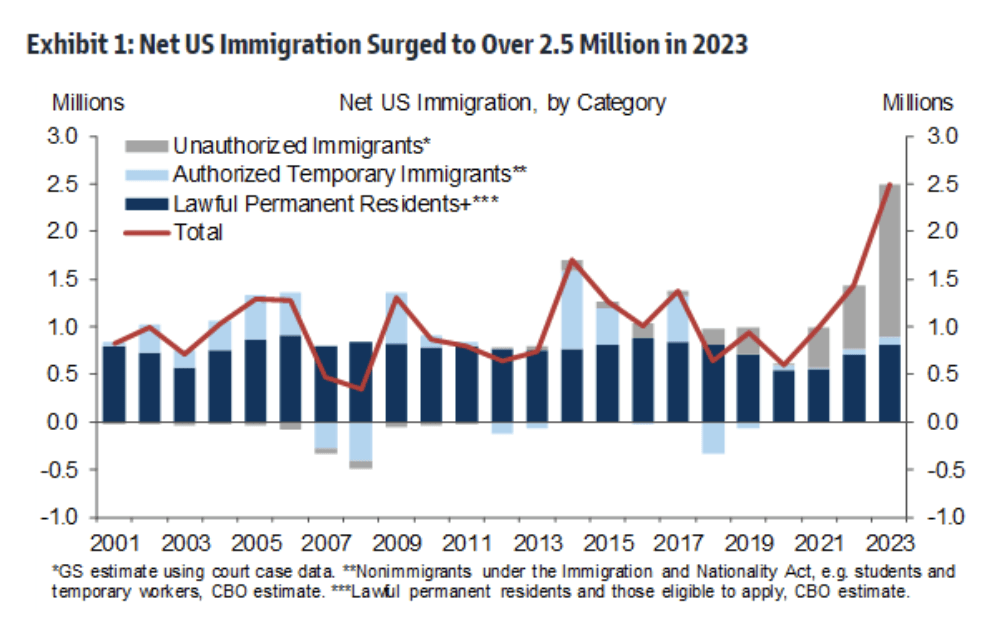
Source: Goldman Sachs
Part-Time Hiring & The Household Survey
After a 38th straight month of rising payrolls, the bulls can point to a 33-month low in year-on-year average hourly earnings as a sign that inflation, while bumpy lately, generally continues to retreat. The bears were quick to highlight that all of last month’s employment gains came from a rise in part-time work while the government and the education/health areas command the majority of job gains. Nevertheless, the household survey, used to calculate the unemployment rate, posted a very strong 523,000 climb – its first increase since last November.
SPX Bounces Back
The bulls won the day with the S&P 500 rising 1.1% to finish off the week. It came after geopolitical fears brewed to the surface on Thursday afternoon amid news that Iran was planning to attack Israel over the weekend. The SPX fell 2% peak to trough with Treasury yields turning lower over the back half of that session in a clear “risk-off” trade. While volatility was short-lived, it’s a reminder that there’s trepidation just under the market’s surface.
PMI Data Point to Better Vibes, Mixed Inflation Gauges
Turning back to macro data at home, the early part of last week featured encouraging signs on the manufacturing front. The ISM Manufacturing Index rose back into positive territory in March. The better-than-expected number featured strong internals, too. The New Orders, Production, and Employment subindexes all increased compared to February. The Prices Paid component jumped to 55.8, however. The highest level since July 2022, driven by hot commodity costs, caused a selloff in the Treasury market last Monday. The 10-year yield was calm, near 4.2%, to close out Q1, but it quickly lifted above 4.3% following the hot manufacturing PMI survey.
But then on Wednesday, the ISM Services report verified weaker than expected. Still in expansion territory, the New Orders subcomponent declined sequentially while Employment and Business Activity picked up. Its Prices Paid subindex missed estimates and helped to send yields lower. Overall, the Composite PMI inflected higher after troughing late last year, suggesting that sentiment is improving across business segments.
Global PMIs Trending Higher After a Stagnant 2023
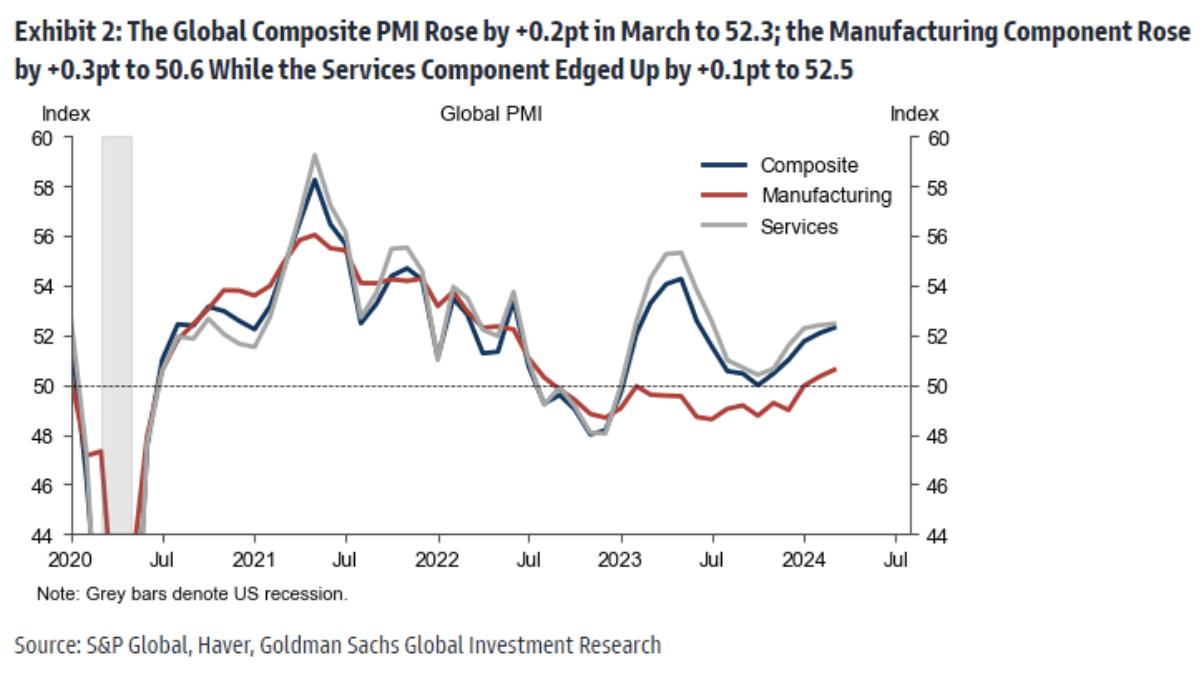
Source: Goldman Sachs
Solid Q1 Economic Activity
As you’d expect, GDP estimates for Q1 took a leg higher after digesting all the big data. The Atlanta Fed’s GDPnow model shows 2.5% for last quarter after dipping to near 2% during the middle of March. The stock market’s performance to firmer growth expectations is impressive considering how sensitive investors were to the rate-cut outlook just a few months ago. The S&P 500 has advanced nearly 10% just as the number of quarter-point eases has been gradually taken down from more than six in January to about two after the March NFP report.
Stocks Rally Despite Fewer Expected Rate Cuts in 2024
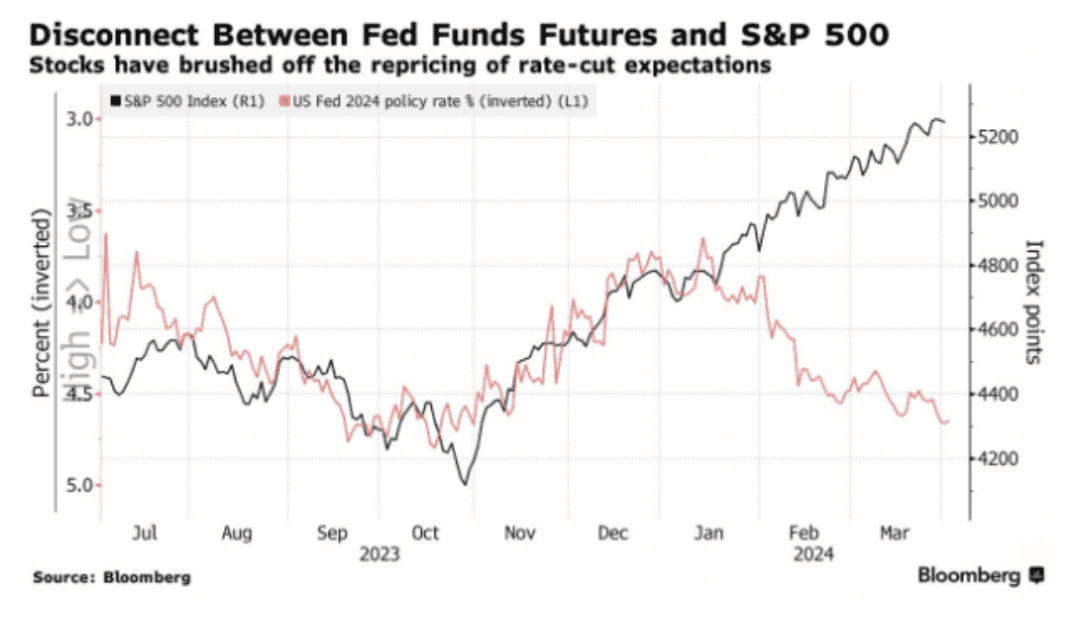
Source: Bloomberg
Cyclicals Eclipse Growth Sectors
Just as notable has been the seamless transition from the tech/AI trade that dominated markets over the first half of Q1 to the sudden alpha of old-school cyclical and value equities. Energy boasts a big lead over Communication Services in the race for the best sector performance on the year while Tech underperforms and Discretionary is merely flat in 2024.
Some of the best relative strength is seen among Industrials and Financials, too. The broader the participation in the rally, the more likely it is that one area of the market can take the baton when small industry stumbles occur. Still, small caps continue to struggle and international equities, while there are some very strong individual country markets, have lagged King S&P in 2024.
Energy’s Breakout to a New All-Time High

Source: Stockcharts.com
Higher Rates: Fine For Now
As we progress into the middle of the year, the breadth perspective will become all the more important as this new group of market leaders takes charge. For now, investors feel fine about the 0.6 percentage point rise in the 10-year yield, but if we see strong inflation data this week, sentiment could shift. What’s more, overseas risks and an outright bull market are macro trends to monitor.
Volatiltiy Jumps to a Multi-Month High

Source: Bloomberg
The Bottom Line
The labor market won’t quit. Yet another strong employment report helped improve the economic outlook in the US. It followed a turn higher in manufacturing PMI reported for March. As the macro grim reaper slays one rate cut after another off the board in the Fed Funds futures market, the improved growth situation and corporate profit trends have outmatched more restrictive Fed policy. All eyes now turn to inflation data this week and the start of Q1 earnings season.
Want access to your own expert-managed investment portfolio? Download Allio in the app store today!
Related Articles


The articles and customer support materials available on this property by Allio are educational only and not investment or tax advice.
If not otherwise specified above, this page contains original content by Allio Advisors LLC. This content is for general informational purposes only.
The information provided should be used at your own risk.
The original content provided here by Allio should not be construed as personal financial planning, tax, or financial advice. Whether an article, FAQ, customer support collateral, or interactive calculator, all original content by Allio is only for general informational purposes.
While we do our utmost to present fair, accurate reporting and analysis, Allio offers no warranties about the accuracy or completeness of the information contained in the published articles. Please pay attention to the original publication date and last updated date of each article. Allio offers no guarantee that it will update its articles after the date they were posted with subsequent developments of any kind, including, but not limited to, any subsequent changes in the relevant laws and regulations.
Any links provided to other websites are offered as a matter of convenience and are not intended to imply that Allio or its writers endorse, sponsor, promote, and/or are affiliated with the owners of or participants in those sites, or endorses any information contained on those sites, unless expressly stated otherwise.
Allio may publish content that has been created by affiliated or unaffiliated contributors, who may include employees, other financial advisors, third-party authors who are paid a fee by Allio, or other parties. Unless otherwise noted, the content of such posts does not necessarily represent the actual views or opinions of Allio or any of its officers, directors, or employees. The opinions expressed by guest writers and/or article sources/interviewees are strictly their own and do not necessarily represent those of Allio.
For content involving investments or securities, you should know that investing in securities involves risks, and there is always the potential of losing money when you invest in securities. Before investing, consider your investment objectives and Allio's charges and expenses. Past performance does not guarantee future results, and the likelihood of investment outcomes are hypothetical in nature. This page is not an offer, solicitation of an offer, or advice to buy or sell securities in jurisdictions where Allio Advisors is not registered.
For content related to taxes, you should know that you should not rely on the information as tax advice. Articles or FAQs do not constitute a tax opinion and are not intended or written to be used, nor can they be used, by any taxpayer for the purpose of avoiding penalties that may be imposed on the taxpayer.