Updated April 15, 2024

Mike Zaccardi, CFA, CMT
Macro Money Monitor
Market Update
Stocks stumbled for a second straight week. The S&P 500 fell 1.6% for its worst weekly decline since last November. In shades of the early weeks of 2024, mega-cap tech outperformed driven by all-time highs in Amazon (AMZN) before Friday’s selloff and a sharp snapback in shares of Apple (AAPL). Stubborn inflation data and a push-out of rate-cut expectations pressured equities following warm CPI data and weak Treasury auctions. The tech-heavy Nasdaq Composite lost just 0.5% while more cyclically exposed small and mid-caps gave back upwards of 3% for the week. Foreign equities underperformed, too, pressured by a multi-month high in the US Dollar Index.
Sector-wise, Information Technology was indeed the smallest loser, falling by just half a percentage point. Taking the market pullback on the chin were some of the market’s biggest winners since the middle of February. Value stocks in the Financials sector gave back a chunk of their 2024 gains with the space declining by nearly 4% just as bank earnings got going. Materials, despite rallies in many metals, fell 3%. Health Care and Real Estate were also weak spots – the latter undoubtedly hindered by the seven-basis-point jump in the US 10-year Treasury note yield.
Bonds lost ground during the week care of generally firm inflation macro data, though a pronounced bid to the fixed-income area on Friday tempered the losses. The market appears increasingly on edge both on the monetary policy front and with regard to developments in the Middle East. The TIPS ETF gave back 0.5%, but it outperformed stocks. Commodities took a breather care of a small 1.4% drop in crude oil; the S&P GSCI Commodity Index was nearly unchanged for the week. There were fireworks in the precious metals market – spot gold surged to an all-time high of $2432 before falling back sharply before the close on Friday in apparent profit-taking. Silver was even more volatile. Traders of all asset classes were uncertain about what the weekend would bring as military strikes by Iran on Israel were reportedly imminent. That turned out to be the case as 50 Iranian drones were launched on the US ally overnight Saturday into Sunday.
For the year, the S&P 500 is up 7.4% and the Nasdaq Composite is higher by 7.8%.
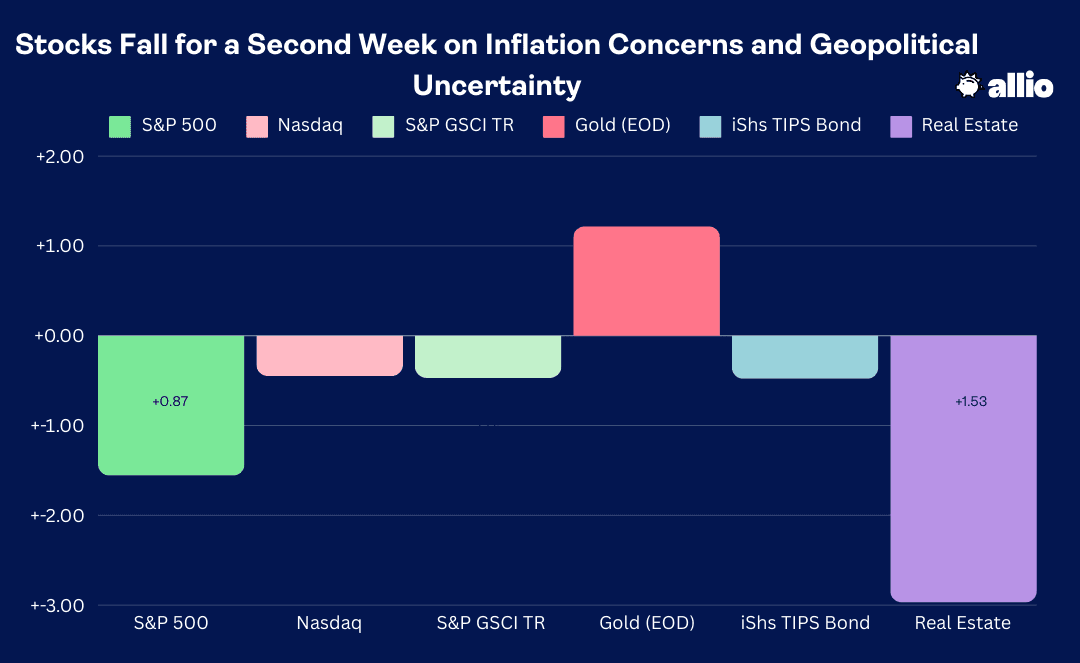
Source: Stockcharts.com
The Look Ahead
The first week of the quarter was all about solid employment trends. Last week it was revealed that inflation remains a primary concern for macro investors and the Fed. This week, Retail Sales, housing market indicators, and Industrial Production provide clues on how strong cyclical areas of the domestic economy are firing.
Before the trading week even gets going, the Census Bureau issues its March Advance Retail Sales report at 8:30 a.m. ET. The consensus calls for a solid 0.4% rise, though the Core Control group is seen increasing by just 0.3%. Recall somewhat soft consumer spending trends over the first two months of the year on a normalized basis. BofA notes that card-spending trends last month, which included the Easter holiday, were quite tepid – down 1.3% year-on-year while Q1 spending was flat compared to the same period in 2023. Still, based on the methodology of the Census Bureau, the numbers should maintain the positive trend seen in February.
Monday morning features a lengthy slate of economic reports. NY Empire Manufacturing PMI hits at the same time as Retail Sales, and a fifth consecutive decline is expected. As with all regional manufacturing surveys, inspecting the Prices Paid, Employment, and New Orders subindexes is important. Homebuilder sentiment is reported at the same time within the NAHB Housing Market Index, seen as a harbinger of real estate activity. Business inventories round out the morning along with an update on Q1 GDP growth from the Atlanta Fed’s GDPnow model. Throughout the week, updates from credit card lenders on delinquencies and charge-offs will also hit the tape.
Tuesday's data deck includes more housing market updates – leading indicators such as Building Permits and Housing Starts come in the pre-market along with Industrial Production, seen accelerating at the headline level. Wednesday is rather light while Thursday features Initial Jobless Claims, expected to hold steady in its recent range, and the Philly Fed Business Outlook is forecast to weaken sequentially from March. The Conference Board’s Leading Economic Index, which finally inflected positive in February, is released at 10 a.m. Thursday as is Existing Home Sales for March.
Elsewhere, the IMF will issue its latest World Economic Outlook on Tuesday, the Fed’s Beige Book comes out Wednesday afternoon, and Fedspeak is heavy from Monday morning through Friday morning. Bitcoin’s much-anticipated halving takes place later this week.
Retail Sales, Industrial Production, Housing Market Data Highlight the Week

Source: BofA Global Research
Earnings Reports This Week
It was a tough start to the first-quarter reporting season. Shares of JPMorgan Chase (JPM) posted decent earnings, but shares fell by more than 6% on Friday – the worst session for the world’s biggest bank since June 2020. Overall, just 6% of the S&P 500 has reported Q1 results, but the bottom-line beat rate is high at 83% through last Friday morning. Estimates call for a small year-on-year rise in earnings, though the actual number will likely be in the +5% to +10% range if historical trends play out.
More bank numbers cross the wires in the pre-market on Monday, headlined by Goldman Sachs (GS). Tuesday BMO features the largest Dow component, UnitedHealth Group (UNH), and more heavy hitters, including Johnson & Johnson (JNJ), Morgan Stanley (MS), and Bank of America (BAC). United (UAL) delivers numbers AMC on Tuesday. Wednesday’s early-morning focus will be on Europe’s ASML (ASML) in the semiconductor industry and then a handful of domestic Financials. That evening, CSX (CSX) provides clues on the transportation niche of the Industrials sector while Equifax (EFX) and Discover (DFS) offer consumer insights.
TSMC (TSM) will keep the chip area in the spotlight Thursday morning and Netflix (NFLX) is the most in-focus Communication Services earnings mover this week. The busy week of Q1 reports wraps up with Proctor & Gamble (PG), American Express (AXP), and Schlumberger (SLB), along with a set of regional bank earnings.
Earnings Reports Broaden Out: Goldman, UNH, ASML, TSM, and Netflix Are In Play

Source: Wall Street Horizon
Topic of the Week: Weighing the Risks
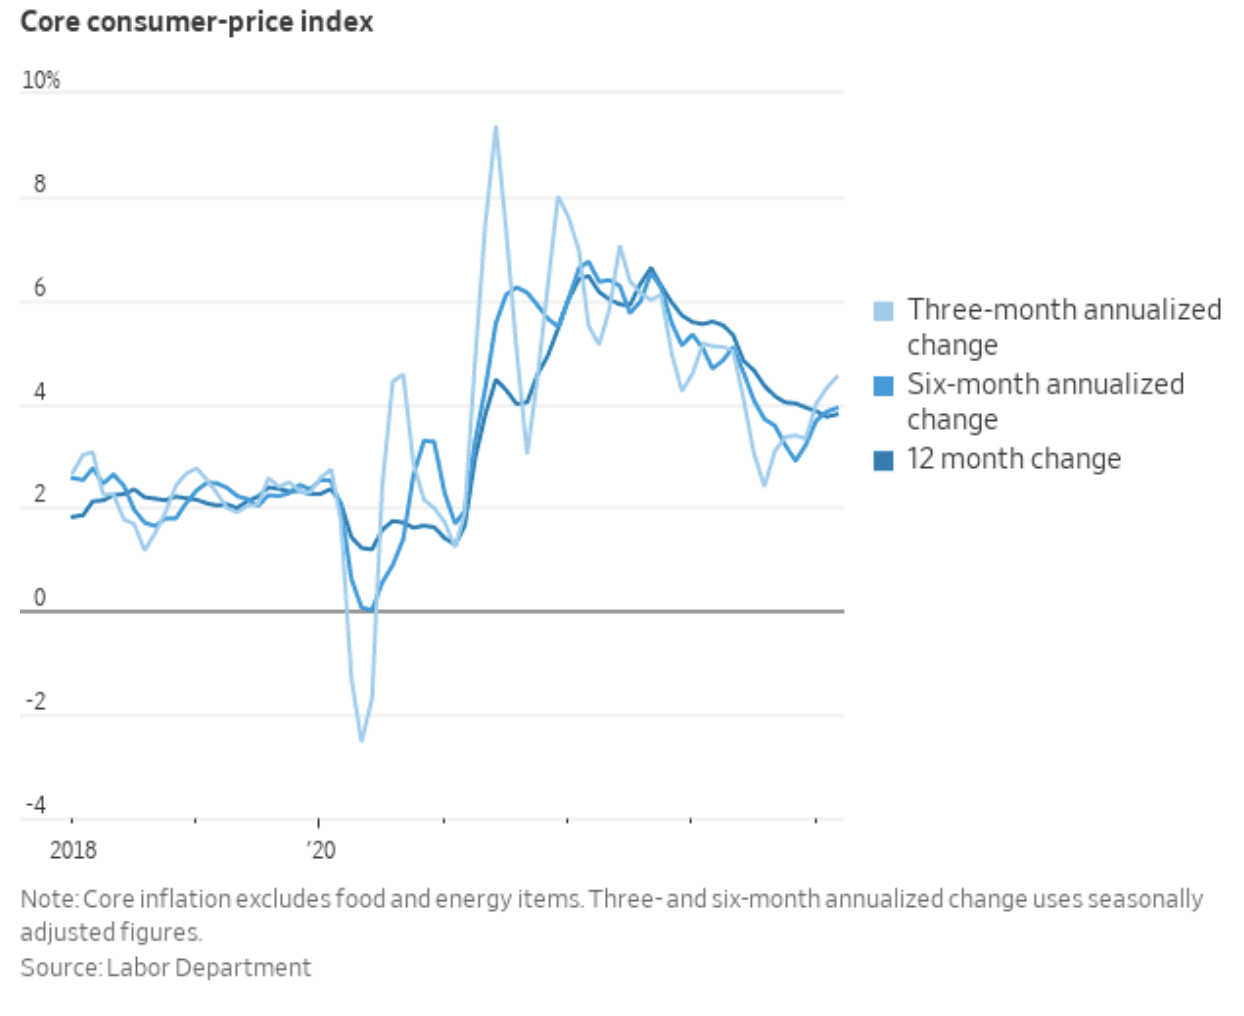
Yet another round of hotter-than-expected CPI data rattled Wall Street last Wednesday. The Headline and Core rates verified at 0.4% on a month-over-month basis while yearly CPI is now 3.5% Headline and 3.8% Core. The numbers were not that much above what economists were forecasting, but it was a fourth consecutive above-consensus YoY CPI reading, underscoring the reality that the final round in the fight against inflation is indeed a heavyweight match between persistent macroeconomic factors and the Fed.
Inflation Hooking Higher, Casting Bearish Clouds on Stocks
Source: The Wall Street Journal
Three Data Points Make a Trend
The hope was that the January and February CPI figures were lifted abnormally by seasonal adjustment factors, but that’s now ruled out. Wage growth humming along at 4%-plus with services inflation sticking to the high side are tough trends to break, even with interest rate policy that is restrictive on several academic measures. Making the headlines in the March CPI report was a stunning 27% three-month annualized increase in vehicle insurance costs – a line item that just about all families across the country feel big time. The goods there is that auto insurance prices lag vehicle price increases by 12 to 15 months, so insurance inflation should cool significantly.
Vehicle Insurance CPI Annualized at 26.7% in Q1, Putting Upward Pressure on Core Services ex-Housing Inflation

Source: Yardeni Research
Bonds Down, Stocks Down
The S&P 500 naturally dropped hard on Wednesday after that morning’s data was released. The 10-year yield surged from 4.34% in the early morning to 4.57% by the afternoon. A soft 10-year Treasury note auction did the bond market no favors, either. The SPX sank 1% while rate-sensitive small caps fell about 3%. Inflationary realities also pushed back expectations for the first Fed rate cut from June to September – traders were expecting between two and three eases this year before the March CPI data, and now only see about 35 basis points of cuts through December.
PPI Relief
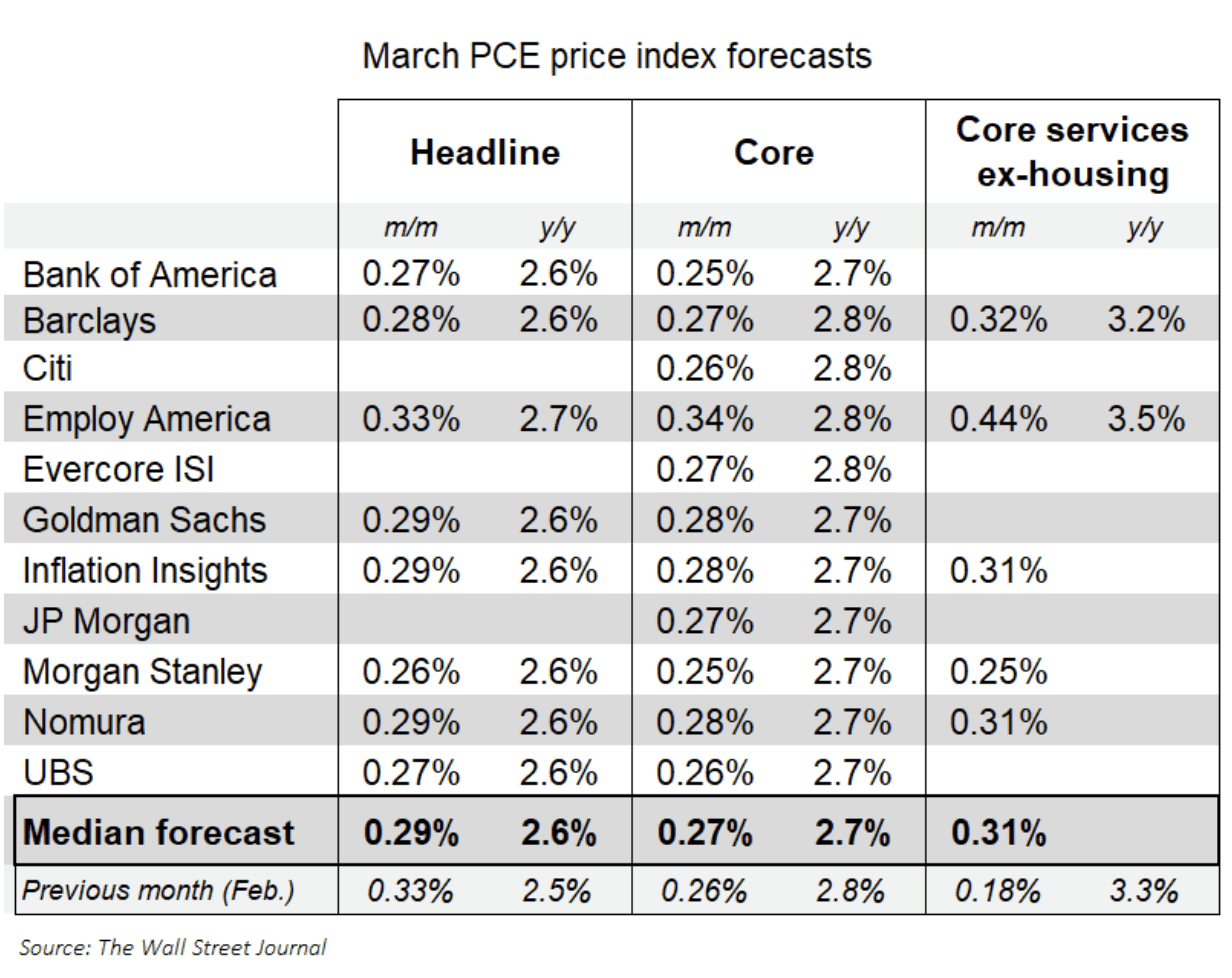
Better news came Thursday, however. March PPI data was softer than expected, rising just 0.2% at both the Headline and Core levels sequentially. PPI numbers flow through to PCE, which is the Fed’s preferred inflation gauge. So, while CPI catches the evening news headlines and is often the focus of macro strategists, the PCE deflator is likely to show US inflation under 3% on an annual basis when the Personal Income & Outlays report is released on March 26.
March PCE Price Index Forecasts: 2.8% Core PCE Expected (YoY)
Source: The Wall Street Journal
This Isn’t 2022, But Inflation Is Still Problematic
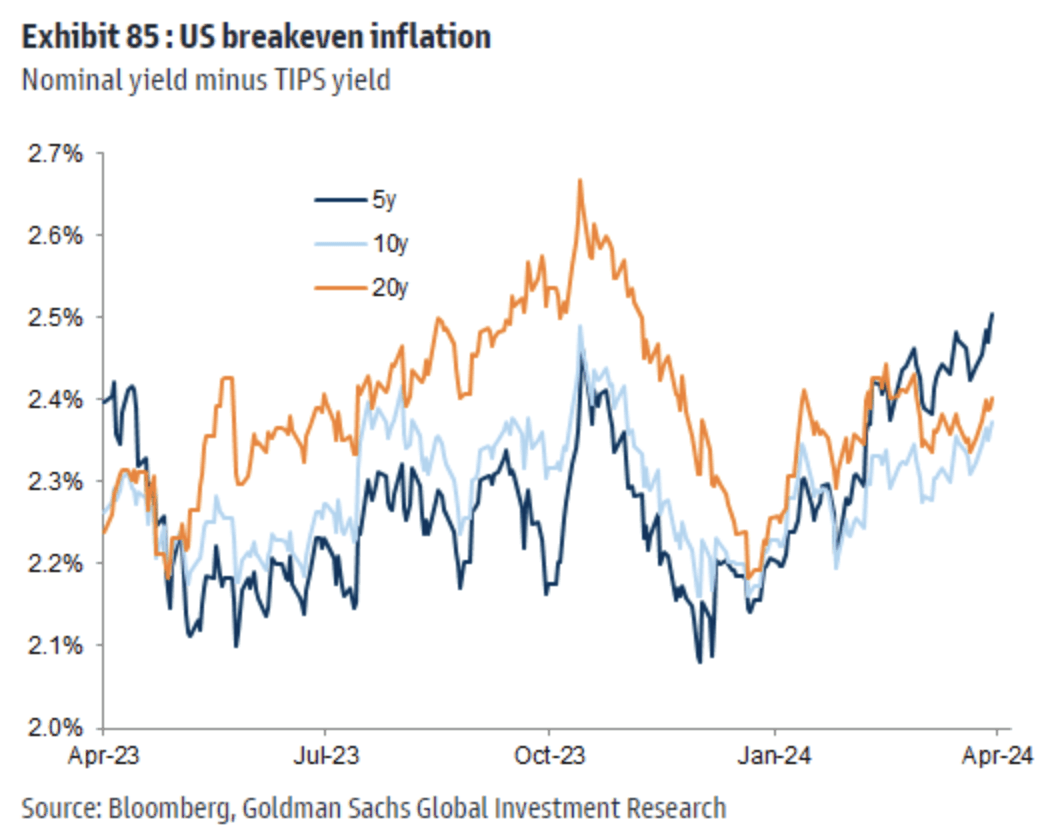
Big picture, it’s clear that inflation remains entrenched to an extent. We see it in CPI, we see it in wages, and we see it in various forward-looking gauges. The inflation swaps market is as hot as it has been in many months, pointing to 2.5% to 2.7% annualized rates across terms while future breakeven inflation levels, as measured through the TIPS market, have crept up to year-to-date highs.
Breakeven Inflation Rates Marching Higher into Q2
Source: Goldman Sachs
Blame the Boomers?
Traditional Fed tools to quell rising consumer prices continue to lack their usual impact. Baby boomers hold much of the country’s wealth, and they carry very little variable-rate debt. A chunk of them owns their homes outright, so they are also sitting pretty as mortgage rates rally back toward 7.4%.
Furthermore, $6.1 trillion of dry powder in money markets, leftover fiscal stimulus, and ongoing massive budget deficits counter the FOMC’s moves to cool off the economy. These broad trends are being baked into inflation expectations. Nearer-term, moving in lockstep with the advance in the consumer price outlook are rising energy prices.
7%-Plus Mortgage Rates Won’t Stop Boomers’ Spending

Source: Mortgage News Daily
The Bull Market in Oil
During last week, both WTI and Brent touched their highest marks since early Q4 2023. US oil rallied through $85 per barrel while global oil prices soared past $90. Escalating tensions in the Middle East shifted investors’ fears from inflation and a “cut on, cut off” trading mantra to a classic “risk on, risk off” environment.
Stocks fell along with fixed income on Wednesday after the inflation data, but bonds caught a big bid on Friday as equities dipped. The safety trade was also seen in the US Dollar Index which jumped above 106 for its highest weekly settle since early October 2023. The VIX closed Friday at 17.3 - a fresh 5-month high.
WTI Remains Higher by Nearly 20% in 2024
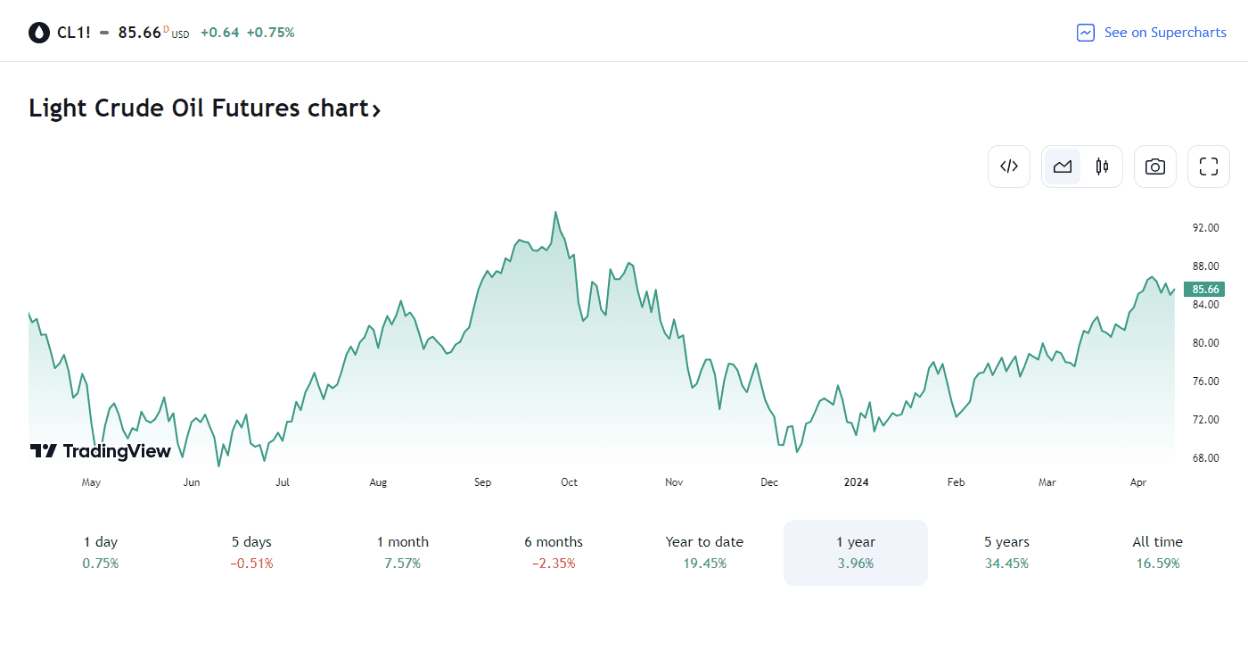
Source: TradingView
Higher For Longer, With an Election Tossed in the Mix
Weighing the risks, traders now see just a 27% chance of a June cut, and odds are that the Fed’s first ease comes in July. Many sellside forecasters expect nothing until December, though, as the November general election throws a wrench in usual policy. GDP growth should come in solid for Q1, perhaps between 2% and 2.5%.
The Bottom Line
The happy-go-lucky market of the first three months of the year appears to at least be on hiatus. Stocks are down in consecutive weeks amid concerns about inflation and what heightened tensions in the Middle East could do to the global economy. This week, more key macro data hits the tape while the first quarter earnings season jumps into high gear, perhaps offering investors a distraction from last week’s volatility catalysts.
Want access to your own expert-managed investment portfolio? Download Allio in the app store today!
Related Articles


The articles and customer support materials available on this property by Allio are educational only and not investment or tax advice.
If not otherwise specified above, this page contains original content by Allio Advisors LLC. This content is for general informational purposes only.
The information provided should be used at your own risk.
The original content provided here by Allio should not be construed as personal financial planning, tax, or financial advice. Whether an article, FAQ, customer support collateral, or interactive calculator, all original content by Allio is only for general informational purposes.
While we do our utmost to present fair, accurate reporting and analysis, Allio offers no warranties about the accuracy or completeness of the information contained in the published articles. Please pay attention to the original publication date and last updated date of each article. Allio offers no guarantee that it will update its articles after the date they were posted with subsequent developments of any kind, including, but not limited to, any subsequent changes in the relevant laws and regulations.
Any links provided to other websites are offered as a matter of convenience and are not intended to imply that Allio or its writers endorse, sponsor, promote, and/or are affiliated with the owners of or participants in those sites, or endorses any information contained on those sites, unless expressly stated otherwise.
Allio may publish content that has been created by affiliated or unaffiliated contributors, who may include employees, other financial advisors, third-party authors who are paid a fee by Allio, or other parties. Unless otherwise noted, the content of such posts does not necessarily represent the actual views or opinions of Allio or any of its officers, directors, or employees. The opinions expressed by guest writers and/or article sources/interviewees are strictly their own and do not necessarily represent those of Allio.
For content involving investments or securities, you should know that investing in securities involves risks, and there is always the potential of losing money when you invest in securities. Before investing, consider your investment objectives and Allio's charges and expenses. Past performance does not guarantee future results, and the likelihood of investment outcomes are hypothetical in nature. This page is not an offer, solicitation of an offer, or advice to buy or sell securities in jurisdictions where Allio Advisors is not registered.
For content related to taxes, you should know that you should not rely on the information as tax advice. Articles or FAQs do not constitute a tax opinion and are not intended or written to be used, nor can they be used, by any taxpayer for the purpose of avoiding penalties that may be imposed on the taxpayer.