Updated April 22, 2024

Mike Zaccardi, CFA, CMT
Macro Money Monitor
Market Update
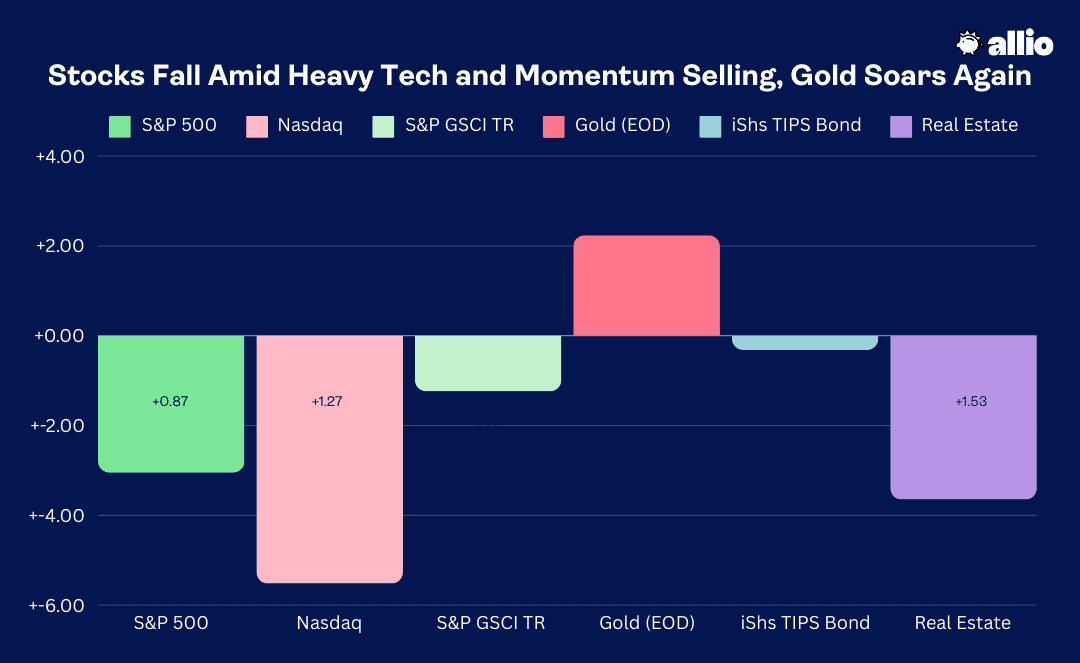
The S&P 500 fell 3.1% last week as heavy selling in tech stocks, particularly on Friday, resulted in the worst weekly decline since the regional banking turmoil of March 2023. The Nasdaq Composite plunged 5.5%, its worst week since the market lows of October 2022. The rocky options-expiration week was highlighted by NVIDIA’s (NVDA) 10% shellacking on Friday – its biggest single-session fall going back to March 2020. It was a momentum-trade unwind throughout the week, but not all stocks endured steep pain.
Across sectors, four of the 11 S&P 500 groups managed to post positive returns, led by the defensive Utilities and Consumer Staples areas. Financials, in focus during the early part of Q1 earnings season, and Health Care, which also features some defensive undertones, finished in the black. Real Estate was among the relative laggards last week, however. Not surprisingly, it was the Information Technology sector that lost the most ground. Falling for the third consecutive week, the 6.3% loss was I.T.’s largest dip in 18 months. The Technology Select Sector ETF (XLK) is now flat on the year after having been up as much as 9% just a few weeks ago. To put the market correction in perspective, the Nasdaq 100 ETF (QQQ) is now underperforming the 1-3 Month Treasury Bill ETF (BIL) thus far in 2024. So much for all that tech bubble talk.
Elsewhere, domestic small caps actually significantly outperformed their large-cap peers. The Russell 2000 ETF (IWM) was off by 2.8% over the earnings-heavy week and foreign stocks barely budged – ex-US equities lost just 1.5% in one of their best relative weeks going back to the start of 2023. In the bond market, the US 10-year Treasury note yield rose 12 basis points to settle at another fresh 2024 weekly high close, pressuring rate-sensitive areas (including Real Estate). The TIPS ETF lost 0.3%, but it has been producing alpha against the intermediate-term Treasury ETF (IEF) all year, losing just 1.5% (total return) compared to a 4.1% loss on IEF in 2024, indicative of rising inflation expectations.
Finally, the busy week of price action included yet another all-time high in gold. The precious metal settled last Friday at $2414 per ounce, good for a $53 weekly climb. Spot gold is now up 16.5% year to date, beating the S&P 500 by more than 12 percentage points. Oil, meanwhile, was volatile, losing 3.8% as tensions in the Middle East persist but fears of severe attacks by either Iran or Israel are, for the moment, subsiding. The US Dollar Index was about unchanged last week.
For the year, the S&P 500 is up 4.1% and the Nasdaq Composite is higher by 1.8%.
Stocks Fall Amid Heavy Tech and Momentum Selling, Gold Soars Again
Source: Stockcharts.com
The Look Ahead
We’ll get key Q1 economic growth clues this week along with updates on the FOMC’s preferred inflation gauge – the PCE Price Index. Monday is quiet as the Fed enters its usual blackout window ahead of next week’s FOMC meeting. Tuesday morning features April preliminary PMI numbers from S&P Global. Recall earlier this month when ISM’s PMIs for March came in strong on the Manufacturing front, rising into expansion territory while the Services PMI declined 1.2 percentage points in March, below expectations. For the April first-read from S&P Global, economists expect both areas of the US economy to continue to be in expansion mode, with the Manufacturing PMI rising modestly and Services dipping fractionally.
Later that morning, data on New Home Sales for March crosses the wires. The expectation is for 669,000 transactions, which would be a slight drop on a seasonally adjusted basis compared with the previous figure. Mortgage rates have increased materially so far this year, creeping up toward the 7.5% mark this month, according to Mortgage News Daily. Then on Wednesday, Durable Goods Orders for March are set to hit the tape. Forecasts predict a strong jump from February’s 1.3% rise while the Ex-Transportation line item is seen increasing by 0.5% sequentially.
In the labor market, Initial Jobless Claims have been remarkably steady in the 210k to 220k range over the last several weeks, and no changes are expected on that front. Also before the bell on Thursday, we will get Wholesale Inventories for March and the all-important first look at Q1 GDP. With hefty Retail Sales reported on Monday last week, forecasters now expect the domestic economy to have grown at a 2.3% seasonally adjusted annual rate last quarter. While that is a deceleration versus Q4 2023, growth-tracking numbers have been on the rise through the first few months of this year. Be sure to keep your eyes on the GDP Price Index and Core PCE for last quarter – hot inflation prints could pressure the bond market while soft consumption prices would pull forward rate-cut expectations. At 10 a.m. ET, Pending Home Sales for March are released.
The most market-moving dataset of the week might not come until Friday. That’s when the Personal Income and Outlays report prints, which includes March PCE price data. Headline inflation is seen at 0.3% for last month while the Core PCE Price Index is expected to have risen by the same amount. On an annual basis, Headline Prices are seen higher by 2.6% and the Core Rate would be +2.7% if the report verifies as expected. While within a percentage point of the Fed’s 2% target, that last inflation mile, so to speak, is indeed the toughest. We’ll also get an update on Americans’ Personal Saving Rate, which is running exceptionally low, as well as a final update on April University of Michigan Consumer Sentiment.
GDP, PCE Inflation, Durable Goods and Housing Market Data in Focus
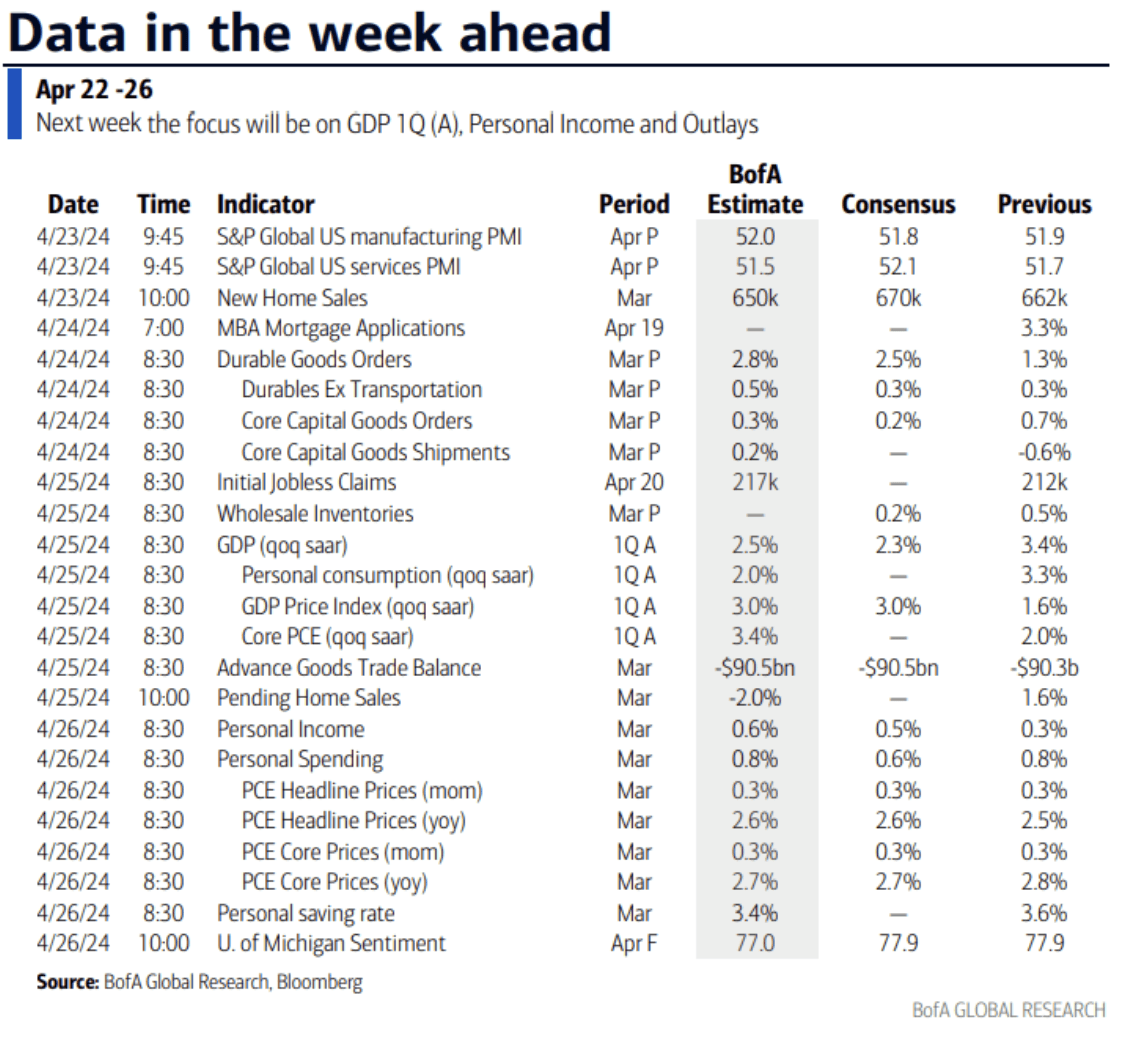
Source: BofA Global Research
Earnings Reports On Tap
The heart of earnings season begins this week. While small and large companies from the Financials sector have commanded the market’s attention, we hear from major multinational firms across sectors over the next handful of days. In all, 158 S&P 500 names issue Q1 results, including 11 Dow components. It has been a somewhat ho-hum reporting period thus far – the EPS beat rate is near the 5-year average at 74% with 14% of SPX companies having reported through last Friday, according to Factset.
With a light macro calendar on Monday, corporate results will be in focus. Verizon (VZ) is the big name before the bell while a host of firms report after the close. PepsiCo (PEP), Novartis (NVS), RTX Technologies (RTX), and UPS (UPS) are the standouts Tuesday morning while Tesla (TSLA) will capture the spotlight that afternoon. Visa (V) will offer insights into the consumer following a decent report from American Express (AXP) last Friday. Texas Instruments (TXN) will be in play as volatility has quickly come about in the semiconductor industry.
Wednesday features more blue chips. AT&T (T) and Boeing (BA) report in the morning while quarterly results from Meta Platforms (META) and IBM (IBM) in tech land will likely move markets. Consumer companies, including Chipotle (CMG), O’Reilly Auto Parts (ORLY), and Ford (F) will be important tells on spending trends. The Health Care sector is in focus on Thursday – Merck (MRK) and AstraZeneca (AZN post numbers during the premarket along with heavy hitters like Caterpillar (CAT) and Honeywell (HON). Thursday is jam-packed with a pair of Mag Seven members – Microsoft (MSFT) and Alphabet (GOOGL) serve up Q1 numbers. The week wraps up with the usual one-two punch from the Energy sector during Week 3 of the reporting season – ExxonMobil (XOM), which recently topped TSLA in terms of market cap, and Chevron (CVX) will dictate price action in the oil & gas space.
37% of SPX Earnings Will be Reported This Week

Source: Wall Street Horizon
Topic of the Week: A Classic Correction?
It’s easy to get laser-focused on the macro right now and then feel like you’ve gotten slapped in the face when stocks stumble. With stubborn inflation trends and geopolitical instability top of mind, equities had been hanging in there as the second quarter got started. We can go back to just two Thursdays ago when the S&P 500 was within 1% of the all-time high close from March 28. But a six-day losing streak, taking the index from above 5200 on April 11 to below the 5000 mark last Friday, reminds investors that stocks can go down, too.
While correction talk is indeed very loud on Wall Street right now, the large-cap US stocks are down just 5.5% from their all-time high. Foreign stocks have declined less so, but are also still down from highs hit in June 2021. The Nasdaq 100 and Russell 2000 Index are closer to technical correction territory, though the latter remains 20% below its November 2021 all-time high.
Correction Checkup: SPX Falls 5.5% From Its Peak
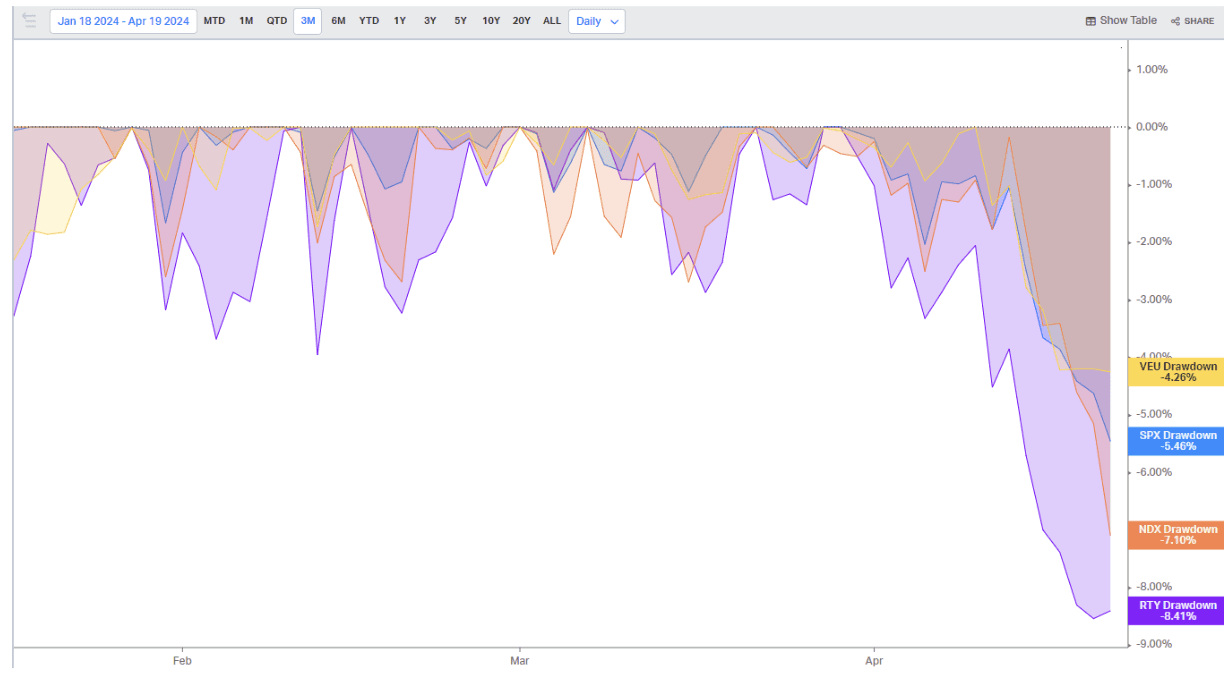
Source: Koyfin Charts
The Broadening Rally Takes a Stumble
Perhaps a pullback was due. The SPX was up close to 30% from the October low to its most recent peak. Small caps initially led the rally as hopes for rate cuts by the Fed, ushered in by cooling inflation, drove gains toward the end of 2023. Tech and AI plays then carried the torch for the first six weeks of the new year before large-cap cyclicals took charge over the back half of Q1. Now, however, some of the year’s biggest winners have endured selling pressure.
Blame it on the Consumer
Price action got off on the wrong foot last Monday. The March Retail Sales report came in rather gangbuster. Hotter than expected, consumer spending was strong during the month which included the Easter weekend. Headline Retail Sales were up a stout 0.7% from February with the ex-autos component jumping 1.1%, sharply above the +0.5% consensus view. The Core Control Group, which feeds into GDP, was also up 1.1%. What’s more, previous monthly figures were revised up following a downward revision in the past reports.
Strong Retail Spending in March Pushed Out Rate-Cut Forecasts

Source: BofA Global Research
‘No Cuts in 2024’ Becoming Increasingly Likely
The S&P 500 fell more than 1% as reality set it in that rate cuts from the Federal Reserve aren’t likely anytime soon. It was the worst set of back-to-back daily declines in the market since last year. As it stands, between one and two quarter-point eases are priced into 2024 – that is down from more than 150 basis points of cuts expected for the year back in early January.
It has Been ‘Higher for Longer’ for Longer Than Average
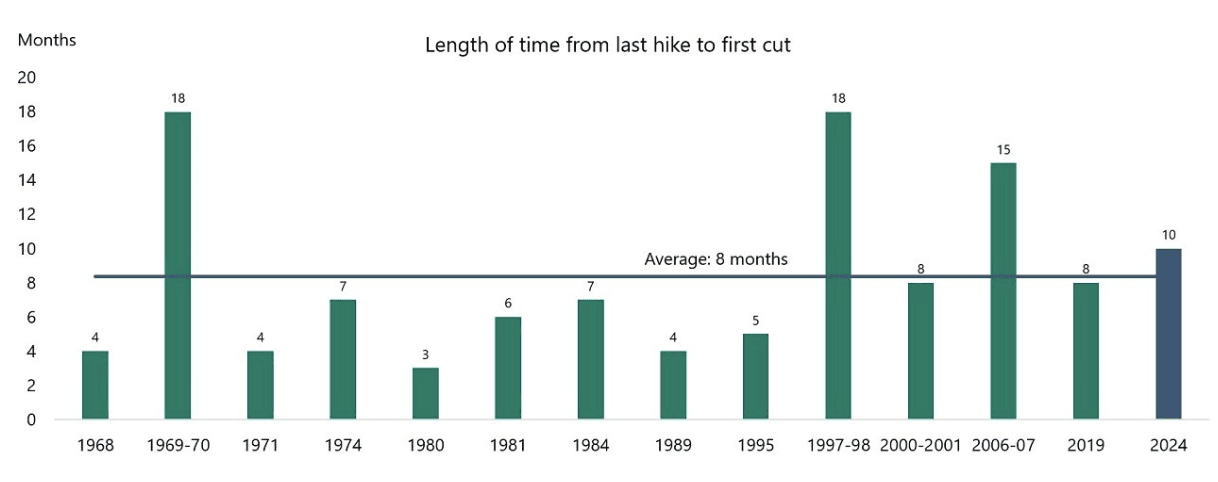
Source: Apollo Global
GDP Growth Numbers Keep Defying Expectations
Americans' penchant for spending will likely result in strong GDP numbers to be reported for Q1 later this week. As has been the trend, early-quarter growth estimates started soft, but gradually increased as more Q1 data came in.
The Atlanta Fed’s GDPnow model sees a 2.9% expansion rate for last quarter while the team at Goldman Sachs forecasts a three-handle, which would be significantly above trend. If the macro stays on track, we’ll play the same game for Q2 and beyond considering that estimates are for a declining pace of expansion through the third quarter – the growth bar is low.
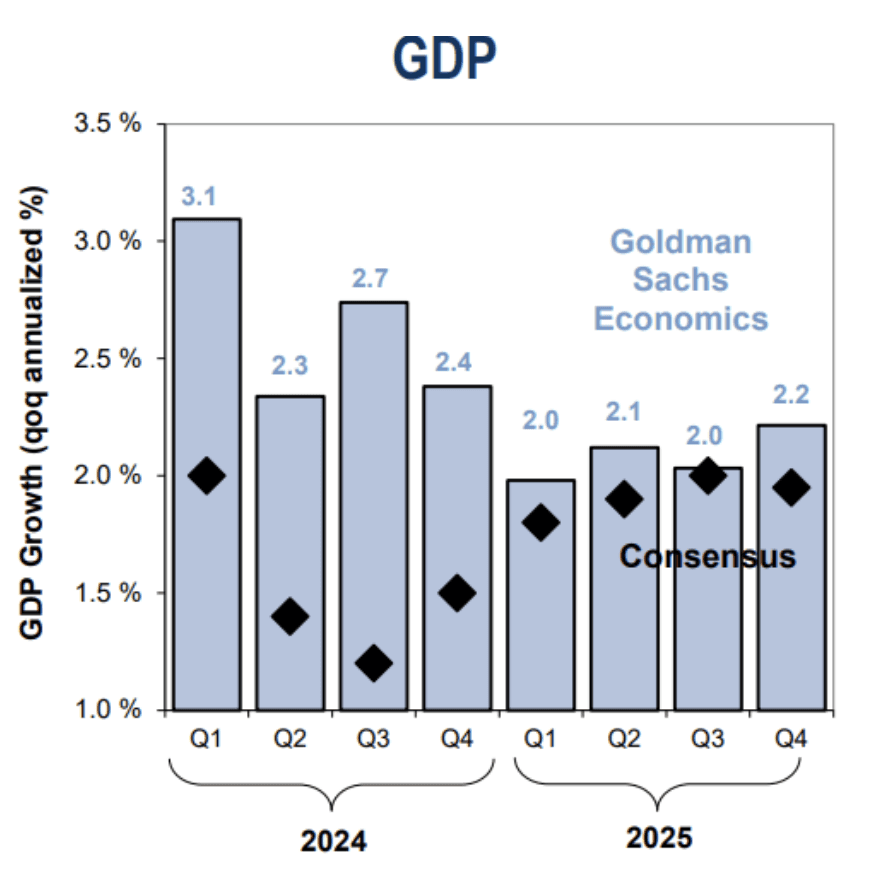
Source: Goldman Sachs
The Bottom Line
The macro backdrop for the US economy remains solid from a growth perspective. The labor market is healthy, and consumers continue to spend with enthusiasm, although sticky inflation certainly plays a role in broad spending trends. The result is a chorus of Fed speakers that has signaled to investors that there won’t be rate cuts until inflation shows firm signs of slowing down. With no Fedspeak until after the May 1 FOMC gathering, all eyes will be on Q1 earnings and late-week macro data.
Want access to your own expert-managed investment portfolio? Download Allio in the app store today!
Related Articles


The articles and customer support materials available on this property by Allio are educational only and not investment or tax advice.
If not otherwise specified above, this page contains original content by Allio Advisors LLC. This content is for general informational purposes only.
The information provided should be used at your own risk.
The original content provided here by Allio should not be construed as personal financial planning, tax, or financial advice. Whether an article, FAQ, customer support collateral, or interactive calculator, all original content by Allio is only for general informational purposes.
While we do our utmost to present fair, accurate reporting and analysis, Allio offers no warranties about the accuracy or completeness of the information contained in the published articles. Please pay attention to the original publication date and last updated date of each article. Allio offers no guarantee that it will update its articles after the date they were posted with subsequent developments of any kind, including, but not limited to, any subsequent changes in the relevant laws and regulations.
Any links provided to other websites are offered as a matter of convenience and are not intended to imply that Allio or its writers endorse, sponsor, promote, and/or are affiliated with the owners of or participants in those sites, or endorses any information contained on those sites, unless expressly stated otherwise.
Allio may publish content that has been created by affiliated or unaffiliated contributors, who may include employees, other financial advisors, third-party authors who are paid a fee by Allio, or other parties. Unless otherwise noted, the content of such posts does not necessarily represent the actual views or opinions of Allio or any of its officers, directors, or employees. The opinions expressed by guest writers and/or article sources/interviewees are strictly their own and do not necessarily represent those of Allio.
For content involving investments or securities, you should know that investing in securities involves risks, and there is always the potential of losing money when you invest in securities. Before investing, consider your investment objectives and Allio's charges and expenses. Past performance does not guarantee future results, and the likelihood of investment outcomes are hypothetical in nature. This page is not an offer, solicitation of an offer, or advice to buy or sell securities in jurisdictions where Allio Advisors is not registered.
For content related to taxes, you should know that you should not rely on the information as tax advice. Articles or FAQs do not constitute a tax opinion and are not intended or written to be used, nor can they be used, by any taxpayer for the purpose of avoiding penalties that may be imposed on the taxpayer.