Updated January 2, 2024

Mike Zaccardi, CFA, CMT
Macro Money Monitor
Market Update
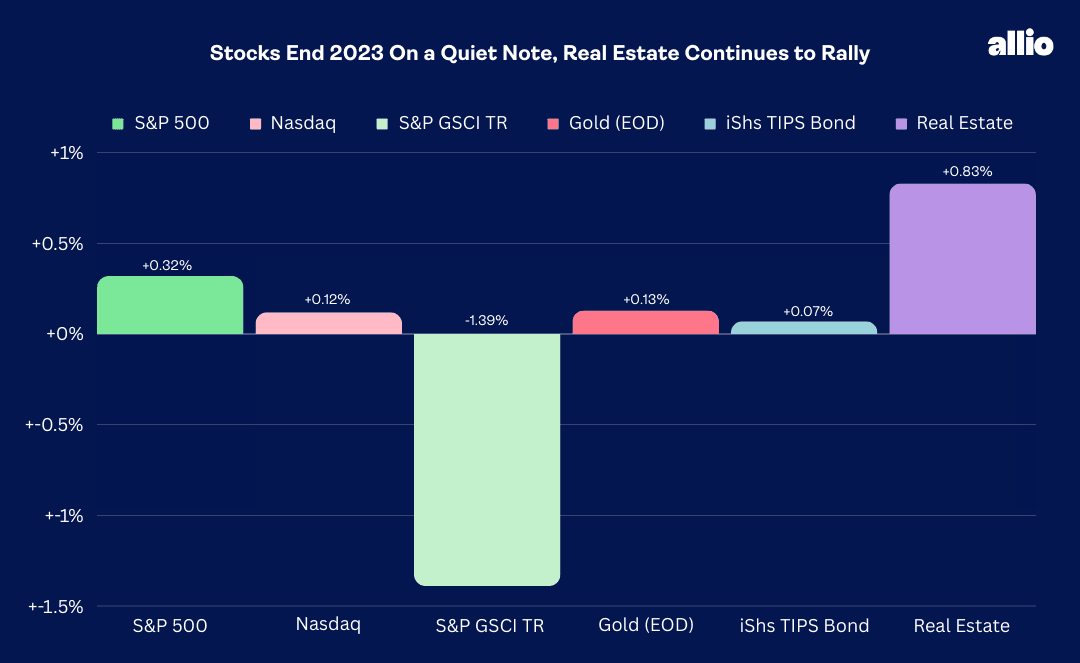
Stocks capped off a stellar year with modest gains ahead of the holiday weekend. The S&P 500 inched up 0.3% for its ninth-straight weekly climb, the longest streak since 2004, rising 4.4% for the month. The fourth quarter was one for the books, a period that began with significant volatility and negative price action, but the bulls regained control by late October, and a double-digit percentage gain was the result.
The Nasdaq Composite was essentially flat over the final four trading days of 2023, but the tech-heavy index advanced 14% in Q4 and recorded its best year since 2003. Small caps led, registering their sixth-best monthly performance since 2001 in December but fell just modestly during the homestretch last week.
Sector-wise, defensive areas such as Consumer Staples, Utilities, and Health Care rose the most while Energy, thanks to lower oil prices, dipped 1%. The Goldman Sachs Commodity Index retreated 1.4% as the US Dollar Index managed to bounce off apparent support near the 101 level. Both commodities and the greenback fell in 2023 despite bouts of strength during the tumultuous third quarter.
Gold eked out a modest gain last week as the precious metal hovers near all-time highs. Finally, the bond market rallied big over the final two months of the year – its best back-to-back monthly total return since September-October 1982. Ironically, amid much drama and Fed-watching, the US 10-year Treasury note yield finished just about unchanged last year, falling a mere two basis points.
For the year, the S&P 500 was up 24.2% and the Nasdaq was higher by 43.4%.
December 22, 2023 - December 29, 2023
The Look Ahead
Investors will shake their cobwebs loose today after the long New Year’s weekend. It’s a fresh slate, and November Construction Spending data hits the tape first in the premarket before a final read on December S&P Global Manufacturing PMI. The real action gets going on Wednesday with ISM Manufacturing for December posting at 10:00 a.m. ET. We expect a soft print given the generally weak regional PMI data posted in the last few weeks but keep your eye on the report’s internals – Employment, New Orders, and Price Paid subindexes may be market-moving. November JOLTS crosses the wires at the same time, and economists expect a continued easing in the number of job openings. Minutes from the dovish December FOMC meeting come Wednesday afternoon along with last month’s motor vehicle sales reports.
Clues on the employment situation are revealed Thursday with the monthly Challenger Grey Job Cuts report for December as well as ADP’s private employment survey. Weekly Jobless claims hit at the usual time, and later on Thursday morning, the final update to the S&P Global Services PMI comes at 9:45 a.m. The major economic data set for the week is of course the December payrolls report, which is expected to show a small, but positive job gain. ISM Services and Factory Orders round out the busy week.
This Week’s Data Deck: ISM Manufacturing, FOMC Minutes, December Jobs Numbers, ISM Services, and Factory Orders

Source: Credit Agricole
Earnings Reports This Week
The fourth quarter reporting period doesn’t officially begin until next Friday, but a handful of household names will report this week. Among them are Cal-Maine Foods (CM), Walgreen Boots Alliance (WBA), Lamb Weston (LW), Conagra (CAG), and Constellation Brands (STZ). You might notice there is a consumer theme, and these firms could offer further color on the strength of household spending over the last few months. On the discretionary side, total holiday spending was slightly weaker than forecasts at +3.1% according to Mastercard SpendingPulse, below the +3% to +4% forecast put out by the National Retail Federation earlier in the year.

Source: Earnings Whispers
Topic of the Week: New Beginnings, New Risks?
As soon as the ball drops in Times Square, institutional investors quickly begin to rethink how they want to be positioned in the year ahead. Recall two years ago – it was the second trading day in January when the S&P 500 marked its all-time intraday high. Stocks would go on to plunge from above 4800 on the index to below 3600 the following October, with technology and growth equities leading the way lower. The value style sharply outperformed that year, too. The tide also quickly turned at the start of 2023. Mega cap names, seemingly left for dead after a 2022 rout, found their footing. The awe of AI led to a boom last year, while a regional banking crisis late in Q1 caused even more money to flock toward what would soon be coined the “Magnificent Seven.” The rest, as they say, was history for 2023.
Calendar-Year Inflections
Source: Koyfin Charts
Hope Abounds for 2024
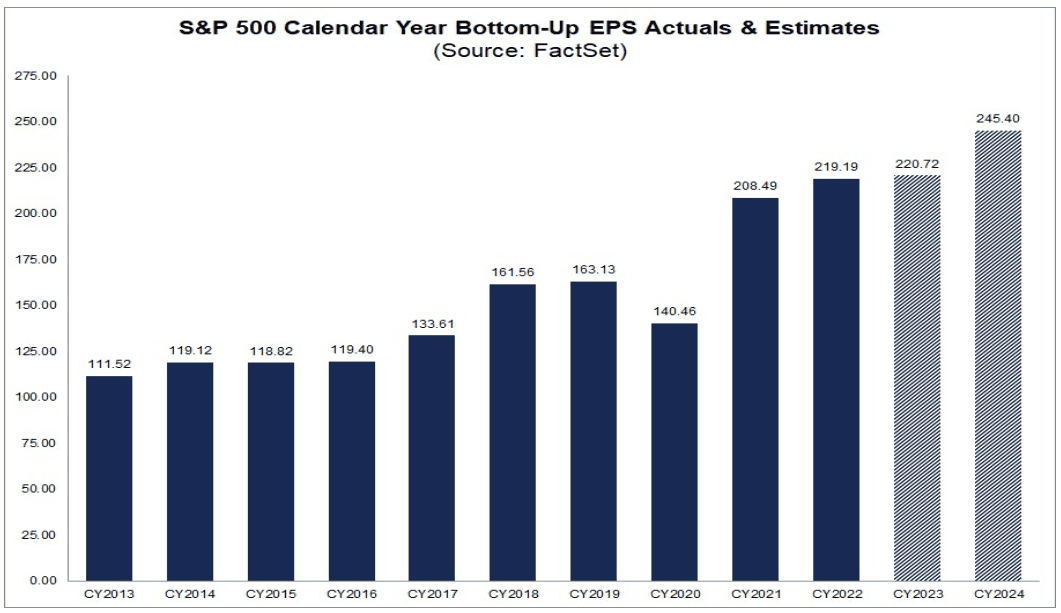
So here we are at yet another potential turning point for global equities amid what appears to be a generally rosy macro backdrop. A year ago, the US unemployment rate was 3.6%; it’s 3.7% today. The S&P 500 rests just below 4800 right now; it was slightly above 3800 in early January last year. Corporate earnings were expected to rise just 3% in 2023; it looks like they will have crept up barely more than 1% depending on how the Q4 reporting period fares. For 2024, the current consensus sees per-share profits rising 11%, all while the inflation outlook remains quite subdued. In the bond market, last year began with the benchmark 10-year Treasury note yielding right about where it is today – near 3.8%. A rekindled bull market in the crypto space also suggests animal spirits are alive and well.
S&P 500 Consensus EPS Forecast: Fresh Highs Expected
Source: FactSet
10-year Yield About Unchanged in 2023

Source: Bloomberg
A More Expensive Valuation
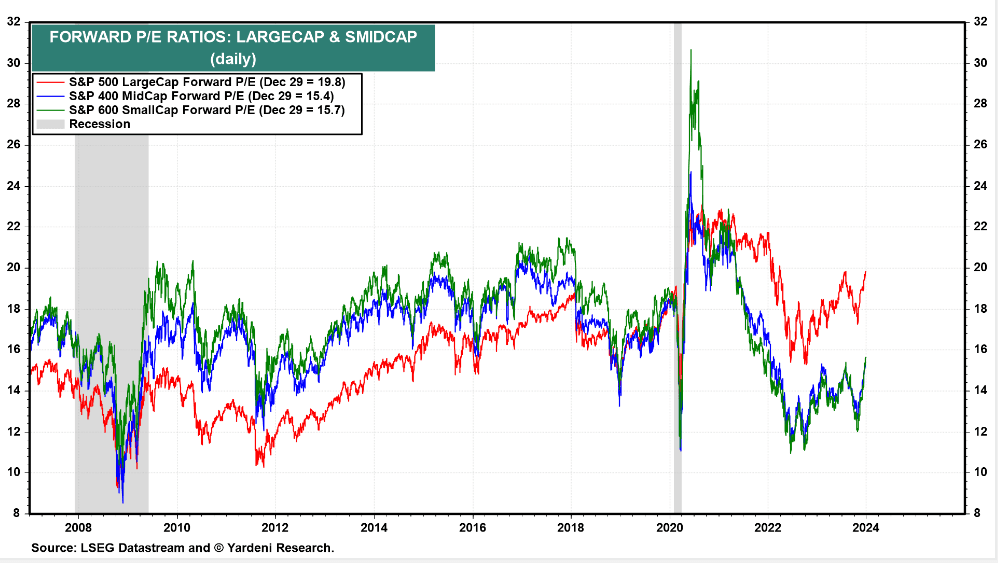
With nearly full employment, an earnings recession that appears to have ended with a turn higher in year-over-year EPS growth in Q3 last year, and the Fed piloting a soft landing, it’s not surprising that we have an S&P 500 that trades a stone’s throw from 20 times forward earnings. Key economic indicators to be released over the coming weeks, along with a fresh set of corporate profit reports, may move the needle to show whether the bigger risk is a domestic economy that is overheating or one that may slow too quickly for the Fed’s liking.
S&P 500 Sells for Near 20x Forward Earnings, Small Caps No Longer a Steal of a Deal
Source: Yardeni Research
A Cooler Inflation Outlook
For now, we can look to the breakeven expectations market for inflation or deflation risks. Across various terms, from 2 years out to 30 years, breakeven inflation rates are positioned just about perfectly. The 2-year breakeven is just 2.02%, implying that the core inflation rate will continue to moderate. Recall last week how we detailed that the 6-month annualized Core PCE percentage is already at the Fed’s 2% target. Meanwhile, the 10-year implied inflation rate is not far from cycle lows at 2.17% as of the close last Friday.
Recovering Capex is a Potential 2024 Tailwind, But Not Without Its Risks
Now, if we see another strong round of corporate earnings reports, with healthy outlooks for the balance of the year and, say, increased capex plans, then that could cause concern among the hawkish FOMC members regarding a bump back up in consumer prices. More aggressive investments, including a jump in bank lending now that interest rates have retreated sharply from their October 2023 highs, could spark some of what we saw back in 2021 – strong domestic demand and the threat of higher inflation. In that scenario, you can wipe away a chunk of the current 151 basis points of Fed rate cuts priced into the Fed Funds futures market. And, as we saw in 2022, the outlook for higher interest rates can have severe impacts on stock prices, even if economic data are on track for the most part.
Could Inflation Turn Too Low?
The flip side is that the bond market may be portending a potentially dangerous scenario of inflation falling too much. There are no immediate signs of deflation permeating the economy anytime soon, but inflation breakevens are generally trending lower, China is essentially exporting deflation to the rest of the world, and interest rate volatility remains high by historical standards. It would not take much of a macro shock to take monthly CPI, PPI, and PCE readings a notch down toward uncomfortably low levels for Chair Powell. Policymakers also tend to ‘fight the last war,’ so to speak, and the FOMC sticking too rigid to a goal of quelling inflation, amid a solidly disinflationary backdrop, is a risk.
Interest Rate Volatility Remains Uncomfortably Elevated

Source: TradingView
The Value of Studying Price Action
It’s a very natural time to ponder what could disrupt the macro landscape. Ultimately, though, it’s what we all don’t see coming that almost always turns out to be the real peril. It was COVID in 2020 and the SVB saga in early 2023 to name a pair of examples. For that reason, investors should always give price action its due – while not always the case, markets will often be the first indicator to sniff out what to be concerned about. At the same time, stock and bond prices will react favorably to news that is genuinely good – AI was a bullish example last year.
Momentum & History Favor the Bulls
So, what’s price action trying to tell us as we begin our journey into 2024? Stocks are coming off an extraordinarily strong two-month rally, led by small caps. Historical trends suggest that these kinds of short-term gains tend to beget more upside thanks to momentum. Ryan Detrick of Carson Group notes that when the S&P 500 is up 20% or more in a year, stocks average a 10% gain the following year. What’s more, when the Russell 2000 rallies 10% or more in a single month, as it did in December, the small-cap index is higher 14 out of 19 times with a typical gain of 16%. It is also a Presidential Election year, and while the sample size is limited, large-cap US stocks tend to post sporty returns when an incumbent is running for re-election compared to other scenarios, so says Stock Trader’s Almanac data.
M&A and IPOs: A 2024 Recovery?
Away from the historical trends and technicals, many macro strategists assert that lower borrowing costs today compared to just a few months ago, along with an uptick in corporate profitability, could result in a renewed wave of both M&A and IPO activity later this year. That would undoubtedly be a positive switch for many industries, particularly the banks who have struggled amid a dearth of corporate dealmaking and an IPO window that cracked open just briefly in Q3, then slammed shut after disappointing debuts by the likes of ARM Holdings from the UK and Birkenstock Holding from Germany. With an increasing amount of corporate dry powder, M&A and IPOs will be important barometers as to the state of banking and appetite for risk at the institutional and C-suite levels.
The Bottom Line
So much can unfold over the next 12 months on the macro front. Stock and bond prices have snapped back in one of the more dramatic nine-week stretches ever seen on Wall Street. Investor enthusiasm has returned while institutional investors have also turned increasingly sanguine on stocks (see the latest AAII sentiment and NAAIM exposure figures). The recent trend is that a new year brings about a reset among investors, and the next few weeks could signal the kind of market to expect in 2024.
Want access to your own expert-managed investment portfolio? Download Allio in the app store today!
Related Articles


The articles and customer support materials available on this property by Allio are educational only and not investment or tax advice.
If not otherwise specified above, this page contains original content by Allio Advisors LLC. This content is for general informational purposes only.
The information provided should be used at your own risk.
The original content provided here by Allio should not be construed as personal financial planning, tax, or financial advice. Whether an article, FAQ, customer support collateral, or interactive calculator, all original content by Allio is only for general informational purposes.
While we do our utmost to present fair, accurate reporting and analysis, Allio offers no warranties about the accuracy or completeness of the information contained in the published articles. Please pay attention to the original publication date and last updated date of each article. Allio offers no guarantee that it will update its articles after the date they were posted with subsequent developments of any kind, including, but not limited to, any subsequent changes in the relevant laws and regulations.
Any links provided to other websites are offered as a matter of convenience and are not intended to imply that Allio or its writers endorse, sponsor, promote, and/or are affiliated with the owners of or participants in those sites, or endorses any information contained on those sites, unless expressly stated otherwise.
Allio may publish content that has been created by affiliated or unaffiliated contributors, who may include employees, other financial advisors, third-party authors who are paid a fee by Allio, or other parties. Unless otherwise noted, the content of such posts does not necessarily represent the actual views or opinions of Allio or any of its officers, directors, or employees. The opinions expressed by guest writers and/or article sources/interviewees are strictly their own and do not necessarily represent those of Allio.
For content involving investments or securities, you should know that investing in securities involves risks, and there is always the potential of losing money when you invest in securities. Before investing, consider your investment objectives and Allio's charges and expenses. Past performance does not guarantee future results, and the likelihood of investment outcomes are hypothetical in nature. This page is not an offer, solicitation of an offer, or advice to buy or sell securities in jurisdictions where Allio Advisors is not registered.
For content related to taxes, you should know that you should not rely on the information as tax advice. Articles or FAQs do not constitute a tax opinion and are not intended or written to be used, nor can they be used, by any taxpayer for the purpose of avoiding penalties that may be imposed on the taxpayer.