Updated April 26, 2023

Raymond Micaletti, Ph.D.
Macro Money Monitor
Market Recap
Stocks crept higher last week amid a flurry of economic data and ahead of the first quarter earnings season. The S&P 500 rose 0.8% while domestic small caps caught a bid for a second straight week. Tech stocks were a relative laggard as the Nasdaq 100 ETF inched up just 0.2%. Perhaps the driver was higher interest rates – TIPS lost more than 1% on the heels of hot inflation expectations data that we will get into later.
Commodities jumped almost 2%, headlined by gold threatening to break out to an all-time high. Alas, the yellow metal turned lower on Friday to settle nearly unchanged for the week. Finally, REITs continued to underperform the broader market, losing another 1.4%, as commercial real estate worries grew.
Chart of the Week: Gold Tests the Highs
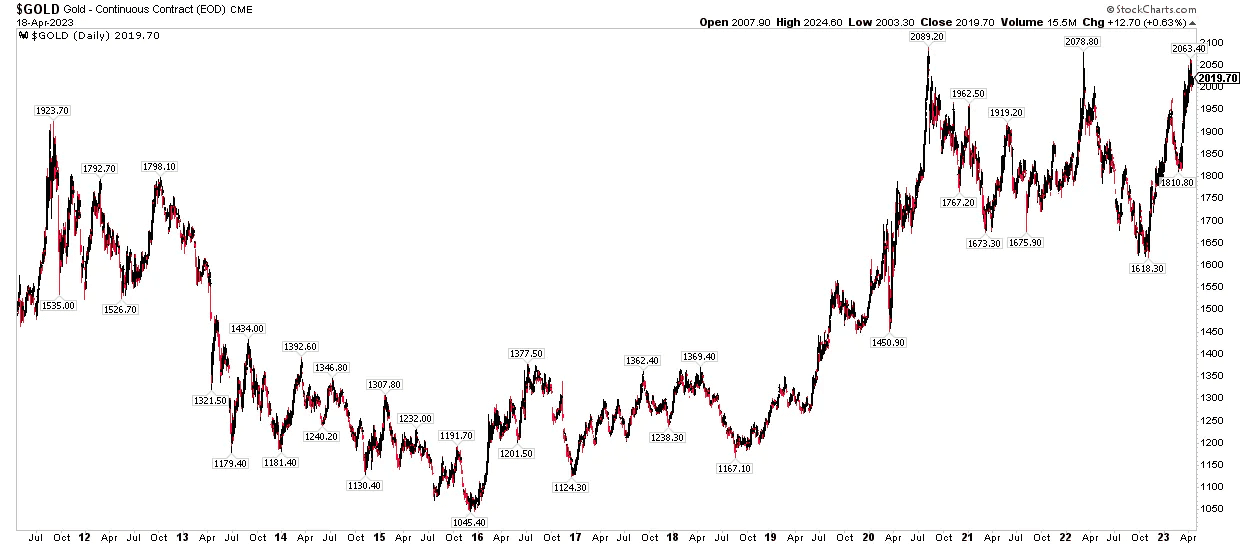
Source: Stockcharts.com
How Far We’ve Come
It’s time for a springtime refresher. Just as cleaning out your closet or garage feels like a win this time of year, reviewing how markets have performed now that Q2 is underway can give us the right perspective. So far in 2023, the S&P 500 has returned more than 8%. That comes after last year’s drubbing which had the double whammy of high inflation eating away at “real” returns.
The gains have been led by the tech sector – the QQQ ETF is higher by 20%, dividends included – while U.S. small caps are up less than 2%. The Russell 2000 has high exposure to the Financials sector, and that has been the worst-performing of the 11 sectors so far this year.
Dollar Not Far From 52-Week Lows
Another macro theme lately has been a weaker U.S. dollar. That’s been a boon to foreign equities with particular relative strength seen in Europe. Over the last year, the broad Euro Area has returned a solid 6% while the S&P 500 is down more than 5% on a total return basis. While the greenback peaked last September, there has been a pronounced slide just in the last month amid weakening economic data.
Treasury Markets Stabilizing, Commodities Tick Up
In the bond space, fixed-income investors have been rewarded with a more than 3% return in the aggregate bond ETF as interest rates have dipped. The turning point was clearly the early to mid-March regional banking turmoil and international financial woes around the saga with Credit Suisse. Treasury market volatility has eased to its lowest level since late February. Commodities, meanwhile, are about flat on the year through mid-April, but there has been a jump in both hard and soft commodities in the last few weeks as the USD has retreated.
Inflation: An Expectations Game
Last week, March CPI and PPI data were not good, despite the administration saying they were. The problem lies in expectations for future inflation and the fact that prices are still rising higher than wages.
Both the April New York Fed survey and the March University of Michigan Consumer Sentiment report revealed that folks on Main Street remain worried about the pace of rising prices. The NY Fed’s survey showed that consumers expect inflation to be 4.7% in the next year while the UMich’s 1-year inflation expectation reading was 4.6%, jumping the most sequentially since 2021.
At Allio, we think the Fed will raise rates by 25 bps in May before a pause. The best we can hope for is a new baseline of 4%.
A Bullish Near-Term Backdrop: Eyeing Seasonality, Breadth, and Positioning
Going forward, the tactical backdrop for equities remains solid. Keep in mind that we are in a bullish phase of the so-called election cycle – strong gains are often seen throughout the third year of a president’s term.
At the same time, though, the May through early October stretch can sometimes feature some volatility – the old “sell in May and go away” stories will no doubt crop up on financial TV and in blogs.
But at Allio, we take an independent look at the drivers of the market going forward.
Spotting A Bullish Breadth Thrust
Something rare took place on March 31. The NYSE registered what’s known as a Zweig Breadth Thrust. The technical event happens only after the 10-day exponential moving average of advancers divided by ‘advancers plus decliners’ moves from below 0.4 (indicative of weak breadth) to above 0.615 within 10 trading days. Famed investor Marty Zweig developed the chart pattern.
For us investors, all we want to know is what happens next. Well, since 1930 there have been 33 breadth thrusts, and the forward return on the S&P 500 going out six months averages about 11% with a more than 75% success rate, according to BofA research. Not bad. Since 1950, it has only happened 14 other times, and the median return is better than 15% with a 100% percent-positive 6-month return, according to Ryan Detrick.
The S&P 500 Performs Well on Average in the Six Months After a Zweig Breadth Thrust
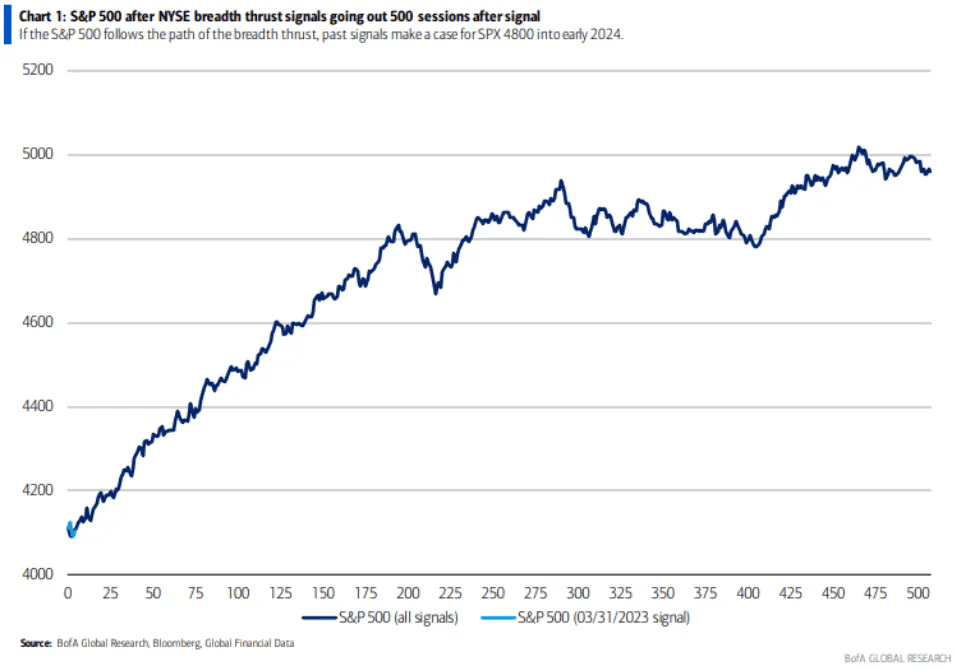
Source: BofA Global Research
Ongoing Bearish Positioning
That is just one indicator, however. And we can never be sure that the March 31 breadth thrust will mimic the historical trends. We also find that investment managers and hedge funds are generally either very short or quite underweight stocks at the moment.
Positioning has been a key theme this year with so many investors caught on the wrong side of the primary trends in 2023 – relative strength in the tech sector with ongoing weakness in financials. Coming into the year, it seemed everyone was saying the same thing: “Go long the banks & cyclicals and short high-duration growth stocks.” That’s proved to be a losing strategy.
As of April 12, the National Association of Active Investment Managers (NAAIM) Exposure Index is in bearish territory, and it has been that way for about two months. We see that as a bullish contrarian indicator.
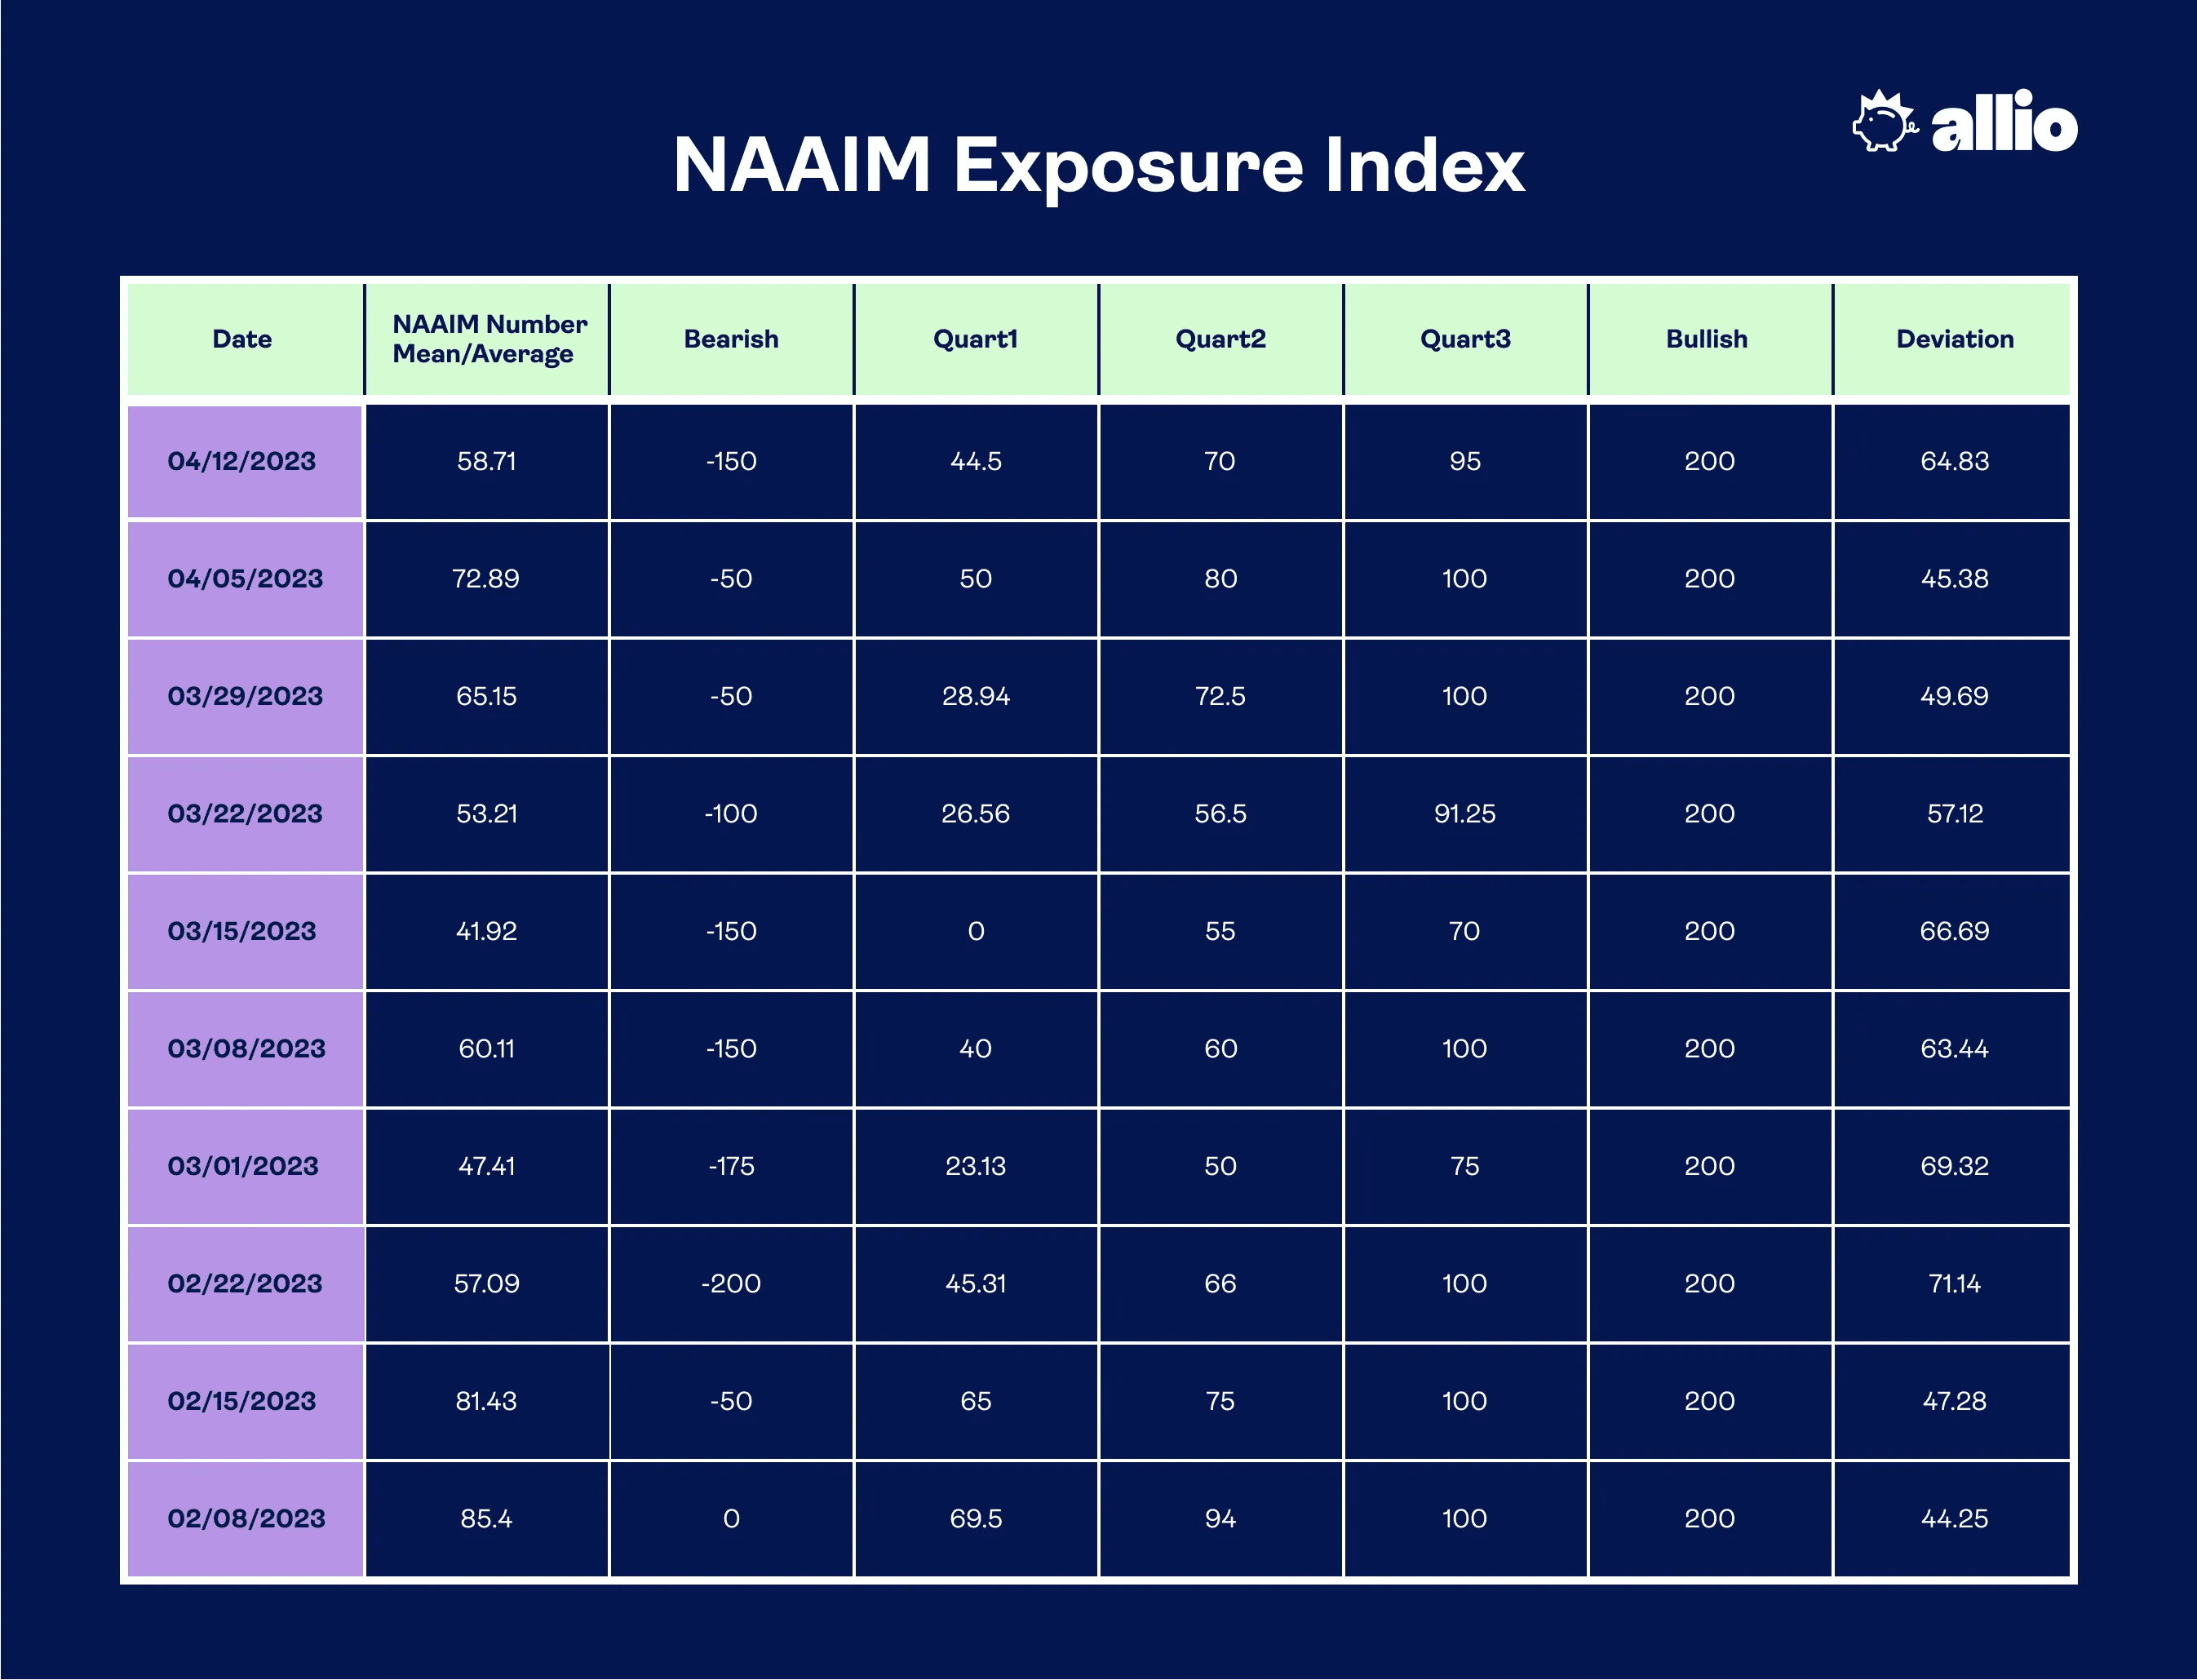
Source: NAAIM
Hedge Funds Betting Against the Rally
Another key gauge of cautious positioning is seen among hedge fund managers. Ahead of last week’s CPI report, net short positions reached the most extreme level since late 2011. That is when the U.S. debt was downgraded and fears of a debt contagion in Europe reached a zenith. With the SPX encroaching on the 4200 level, rising more than 7% since March 14, the “smart money” has not looked so wise.
Hedge Funds’ Net Bearish Positioning Reaches Decade-Plus Extreme

Source: Bloomberg
Considering light positioning among investors and outright bearish bets by big hedge funds, a short squeeze could propel stocks over the ensuing weeks. That's just something to watch out for in the near term.
Reality Check: Valuations Are Elevated
Strategically, however, valuations are a heavy concern. As of last Friday, the forward non-GAAP price-to-earnings ratio on the S&P 500 stood at a lofty 18.3, per FactSet. That is above the 10-year average earnings multiple of 17.3. The difference today is that there are much higher interest rates compared to the zero-interest rate policy period of the 2010s through the beginning of last year. So, such a valuation premium to history is probably not justified.
Propping up the P/E is the collective multiple of the eight biggest domestic tech-related stocks. The “MegaCap-8,” made up of Apple, Microsoft, Alphabet, Amazon, Tesla, Meta Platforms, Netflix, and NVIDIA, are pricey at more than 27 times forward earnings while the rest of the S&P 500 has a 16.2x valuation as of April 7.
S&P 500 Forward P/E Ratio: Above 18 Care of Expensive Tech Stocks
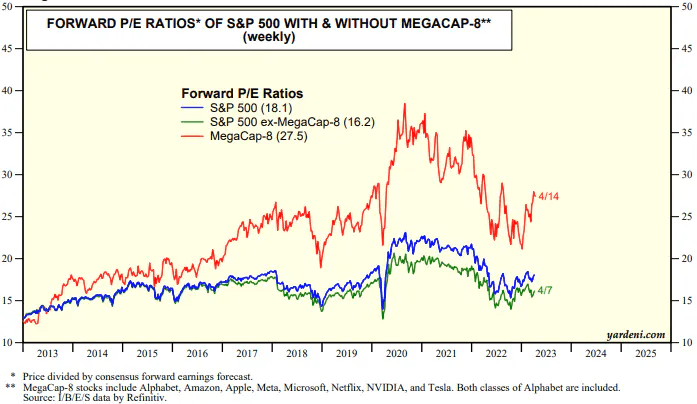
Source: Yardeni Research
2023’s Rally Built on Multiple Expansion – Can That Last?
So, stocks are not a screaming buy on valuation by any means, at least in the U.S. And what could lead to multiple contraction over the following quarters could be a more dismal economic situation. The macro landscape is clearly slowing. One of our favorite go-to's is the Citi Economic Surprise Index which simply measures how data is verifying relative to the consensus expectations.
While the index is still in positive territory, the April 14 reading is off the peak reached earlier this month. There is more to the story, though. A big weight in the index is the monthly payrolls report. Remarkably, there have been 11 consecutive beats on the headline jobs number. Back out that backward-looking and questionable labor market gauge, and the economic data situation is not so rosy.
Economic Data Is Sagging, Particularly When Excluding the Monthly NFP Report
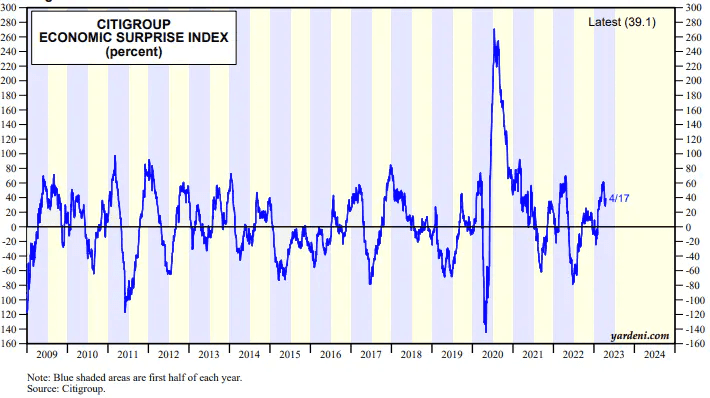
Source: Yardeni Research
An Uncertain Earnings Backdrop
The labor market, retail sales, manufacturing and services ISM and PMI data, and inflation are all critical to assessing the strength of the macro landscape, but all eyes are now turning to the bottom line. Q1 earnings season is in full swing. The big banks have generally reported EPS beats, but those figures came on sharply reduced estimates.
Consider that as of last June, the 2023 earnings outlook for the S&P 500 was north of $250 per share. Jump ahead to today, and that figure stands at just $220 (and it’s falling precipitously). We expect a healthy earnings surprise percentage to be reported this season – that's just how the game works on Wall Street. But there is no hiding the reality that the economy is worsening, and it is likely just a matter of time before corporate profits are diminished.
S&P 500 EPS Forecasts Continue to Drop: $220 Expected for 2023, $247 in 2024

Source: FactSet
The Bottom Line
Putting it all together, equities are essentially moving higher on positioning and liquidity. The Fed’s balance sheet expanded big league around the March banking woes, and investors, including hedge funds, have been caught on the wrong side of the boat. The seas could indeed turn rough and even dangerous at times.
That said, while the market will be choppy and a dip could be in-store, so long as positioning remains unchanged, we’re expecting any dip to be followed by further upside driven by infrastructure spending, divided government and a pause in rate hikes post May.
Want access to your own expert-managed investment portfolio? Download Allio in the app store today!
Related Articles


The articles and customer support materials available on this property by Allio are educational only and not investment or tax advice.
If not otherwise specified above, this page contains original content by Allio Advisors LLC. This content is for general informational purposes only.
The information provided should be used at your own risk.
The original content provided here by Allio should not be construed as personal financial planning, tax, or financial advice. Whether an article, FAQ, customer support collateral, or interactive calculator, all original content by Allio is only for general informational purposes.
While we do our utmost to present fair, accurate reporting and analysis, Allio offers no warranties about the accuracy or completeness of the information contained in the published articles. Please pay attention to the original publication date and last updated date of each article. Allio offers no guarantee that it will update its articles after the date they were posted with subsequent developments of any kind, including, but not limited to, any subsequent changes in the relevant laws and regulations.
Any links provided to other websites are offered as a matter of convenience and are not intended to imply that Allio or its writers endorse, sponsor, promote, and/or are affiliated with the owners of or participants in those sites, or endorses any information contained on those sites, unless expressly stated otherwise.
Allio may publish content that has been created by affiliated or unaffiliated contributors, who may include employees, other financial advisors, third-party authors who are paid a fee by Allio, or other parties. Unless otherwise noted, the content of such posts does not necessarily represent the actual views or opinions of Allio or any of its officers, directors, or employees. The opinions expressed by guest writers and/or article sources/interviewees are strictly their own and do not necessarily represent those of Allio.
For content involving investments or securities, you should know that investing in securities involves risks, and there is always the potential of losing money when you invest in securities. Before investing, consider your investment objectives and Allio's charges and expenses. Past performance does not guarantee future results, and the likelihood of investment outcomes are hypothetical in nature. This page is not an offer, solicitation of an offer, or advice to buy or sell securities in jurisdictions where Allio Advisors is not registered.
For content related to taxes, you should know that you should not rely on the information as tax advice. Articles or FAQs do not constitute a tax opinion and are not intended or written to be used, nor can they be used, by any taxpayer for the purpose of avoiding penalties that may be imposed on the taxpayer.