Updated November 6, 2023

Mike Zaccardi, CFA, CMT
Macro Money Monitor
Market Recap
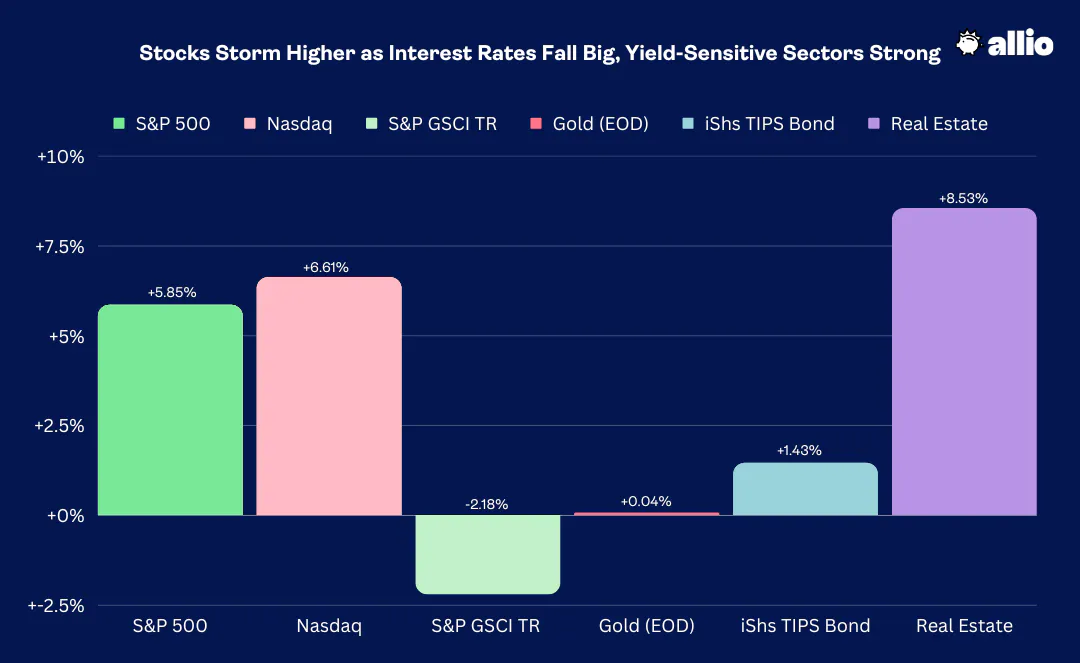
Stocks rose each session last week, culminating in a strong Friday rally as interest rates fell big. In all, the S&P 500 jumped 5.9% while the Nasdaq Composite rallied 6.6%. It was the strongest week for the SPX since November last year. Small caps did even better with the Russell 2000 launching almost 8% - its best week since early 2022.
Performing best among the market’s 11 sectors was the embattled Real Estate space – a clear winner from easing Treasury yields. Financials were also strong with heavy buying across the rate curve – the benchmark 10-year Treasury note yield dropped back from near 5% at its October high to settle the week at 4.56% - the TIPS bond fund rose 1.4%.
Elsewhere, selling was the story in the oil market. WTI ended barely above $80, shedding close to 6% in a week where the US Dollar Index flirted with breaking below key support levels. In all, the broad commodities basket retreated 2.2%. Gold, meanwhile, rallied back above $2000 per ounce at times on Friday amid the major giveback in real interest rates.
The S&P 500 is now up 13.5% year to date while the Nasdaq is positive by 29%.
October 27, 2023 - November 3, 2023
The Look Ahead
Market-watchers get a reprieve this week. The data deck is light with just the University of Michigan Consumer Sentiment report being the highlight on Friday, and the bond market is closed then for Veterans Day observance. We could see some volatility Monday evening when the Senior Loan Officer Opinion Survey (SLOOS) on bank lending conditions crosses the wires, but traders have largely come to grips with the reality that banks with questionable balance sheets (imbalanced fixed income assets and liabilities) may fare worse if rates march higher.
Jobless Claims (both initial and continuing) continues to be an interesting report to attempt to glean trends in the labor market. Continuing claims, in particular, have been on the incline, and Friday’s October jobs report further underscores that the employment situation has softened (much to the Fed’s delight). Fed Speak will be active this week with the Chairman speaking Wednesday and Thursday.
This Week's Data Deck: Trade Balance, Jobless Claims, Consumer Sentiment, (SLOOS on Monday)

Source: BofA Global Research
Earnings Reports This Week
It’s the last major week of third-quarter corporate earnings. The caveat there is that we have not yet heard from the big retailers, and NVIDIA (NVDA) also reports later in November. With more than 80% of the index having issued results, the EPS beat rate is impressive at 82% - that’s the strongest reading in two years.
What’s more, S&P 500 earnings per share is now seen rising by 3.7% for the quarter that just ended – expectations were for a contraction in year-over-year EPS as of the end of September. The problem for the bulls is that negative earnings revisions have been the forward-looking narrative, but maybe this week’s slate of reporters can buck that trend.
Key announcements come from firms across sectors. Uber (UBER) is the first big name with its results hitting the street Tuesday morning before Rivian (RIVN) results after the bell. Devon (DVN) and Occidental Petroleum (OXY) also come Tuesday evening along with Gilead (GILD) in the Health Care space. Under Armour (UAA), AMC (AMC), and Disney (DIS) all offer glimpses at how the consumer is fairing on Wednesday. Finally, Wynn Resorts (WYNN) provides a look at travel demand Thursday night.
Final Big Week of Q3 Earnings
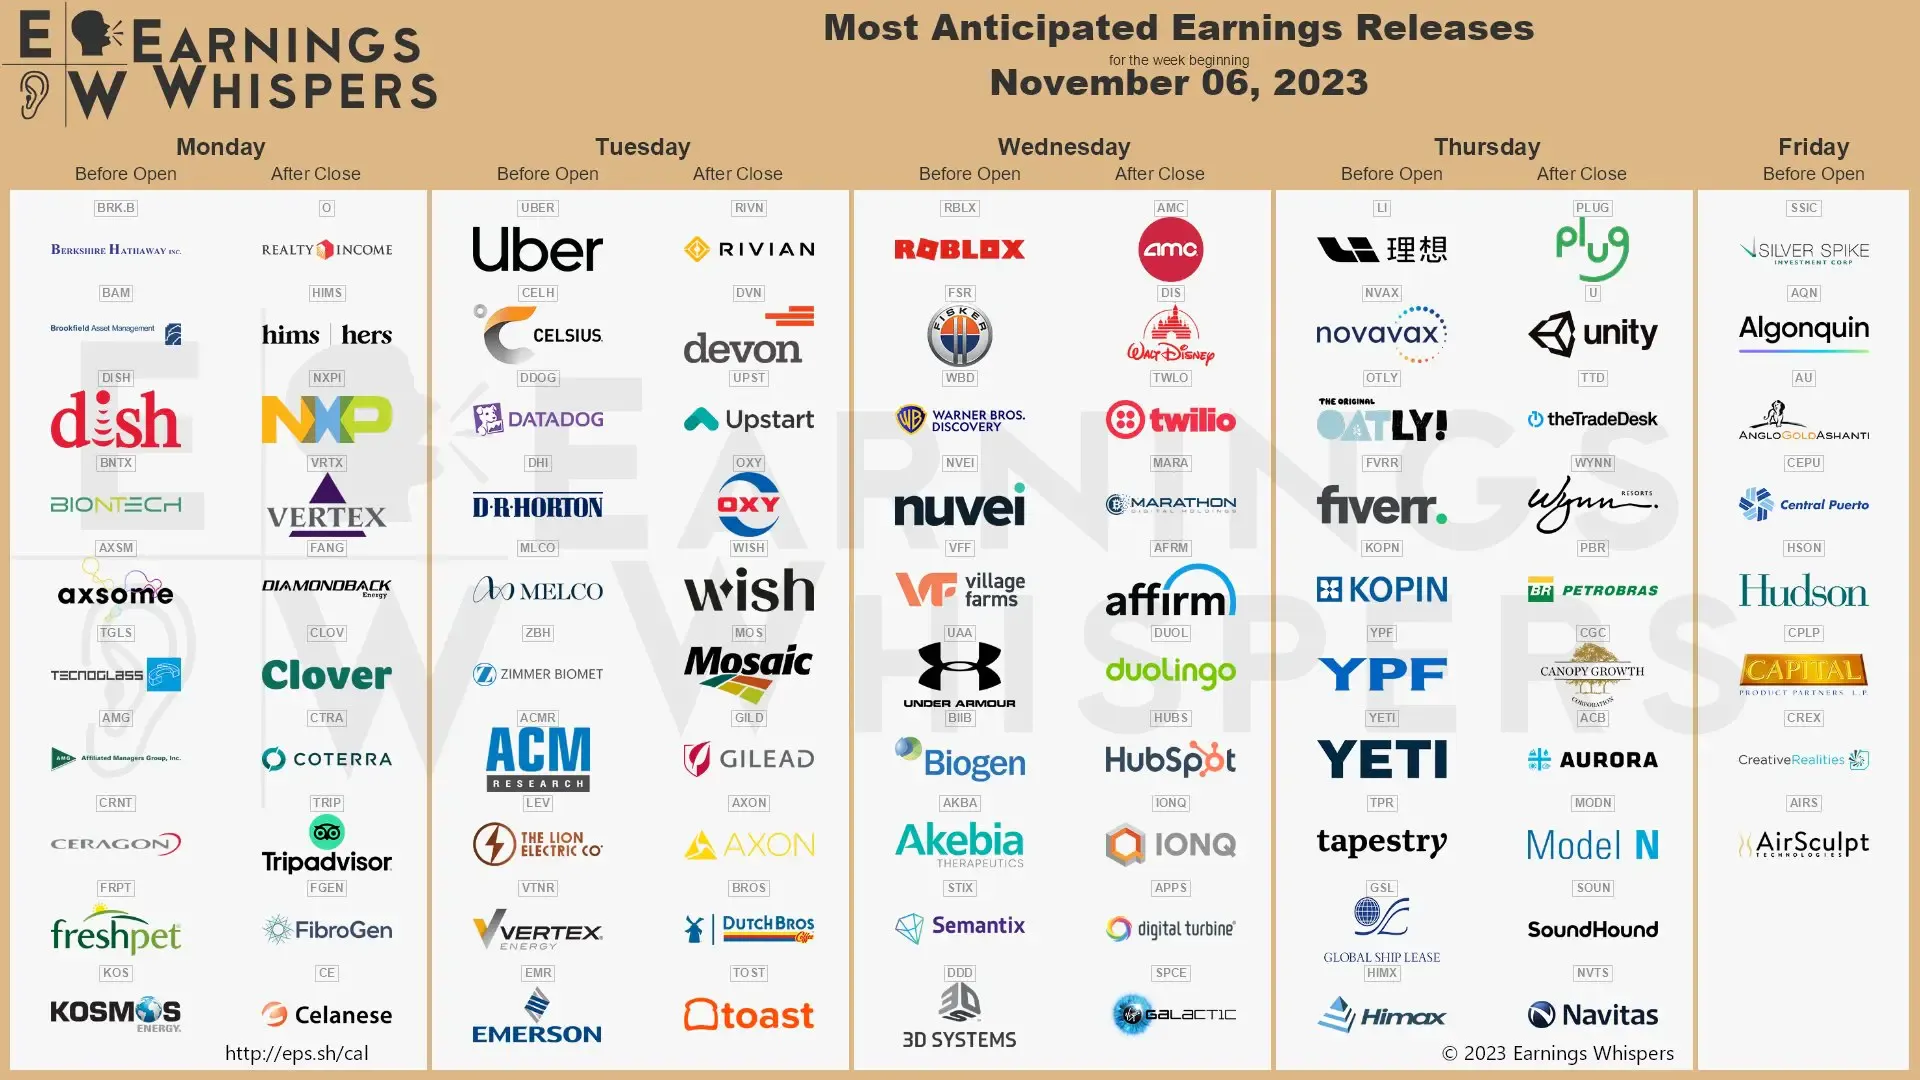
Source: Earnings Whispers
Topic of the Week: Running the Table
The “immaculate disinflation” narrative remains alive. The headliner economic data point last week was Friday’s October jobs report. The 150k rise in monthly employment was softer than expectations, and earnings data – both average hourly earnings and weekly hours worked – came in lighter compared to September. While it was the 34th consecutive month of payroll gains, the labor market is clearly weaker compared to just six months ago.
The unemployment rate also ticked up to its highest level since last January at 3.9%. The two previous months’ headline gains were revised lower by some 101k positions, a trend apparent in the BLS’s data for much of this year. Of course, the United Auto Workers’ strike negatively impacted the October jobs by about 33k positions and roughly 10k positions may have been lost from the Hollywood writers’ strike.
No matter how you slice it, the October employment situation slowed. Private payrolls rose just 99k, well below the +145k consensus. Key in my view, though, was the 0.1% miss on average hourly earnings and the 0.1 hours fall in average weekly hours – combine those two, and it’s a significant reduction in pay for Americans, equivalent to a significant jobs contraction. Average hourly earnings at +0.2% was the weakest since February 2022 while its 4.1% rise on a year-over-year basis marked a fresh cycle low. Finally, the household labor market survey, used to determine the unemployment rate, actually revealed a 348k net employment loss.
And it was all ideal news for the stock and bond bulls. This is just the kind of labor market softening Chair Powell and the rest of the FOMC want to see, and perhaps it was the reason why Jay’s press conference was to the dovish side (although the Chair technically does not see the full NFP report until the evening before its release to the public). Still, a loosening of the employment picture helped send stocks to their best week in many months while Treasury yields plunged like we haven’t seen since the flight-to-safety period this past March.
Weak & Dovish Employment Data All-Around
The October jobs report came on the heels of a light ADP Private Employment report earlier in the week as well as the monthly Challenger Gray Job Cuts number that ticked up. The lone hot labor market data point came via the Job Opening and Labor Turnover Survey (JOLTS) report on Wednesday – but that’s a September look. All signs point to easing job creation as we head into the holiday season and 2024.
The first week of the month also marks the arrival of key ISM data. At 46.7, the ISM Manufacturing PMI verified much weaker than expected, also helping to cool the inflation narrative (anything under 50 is considered contraction). While it’s considered ‘soft’ data, the Prices Paid component was notably weak at just 45.1, though that was an increase from September’s 43.8 figure. Employment was particularly light at 46.8 versus the 51.2 consensus. Also, New Orders, a harbinger of future demand, plunged to 45.5.
Yields began their descent right around the release of that data at 8:30 a.m. ET Wednesday. The 10-year rate went from near 4.9% to under 4.8% in short order, but Treasury buying did not end there.
US ISM Manufacturing PMI Falls Shy of Expectations, Pressuring Yields
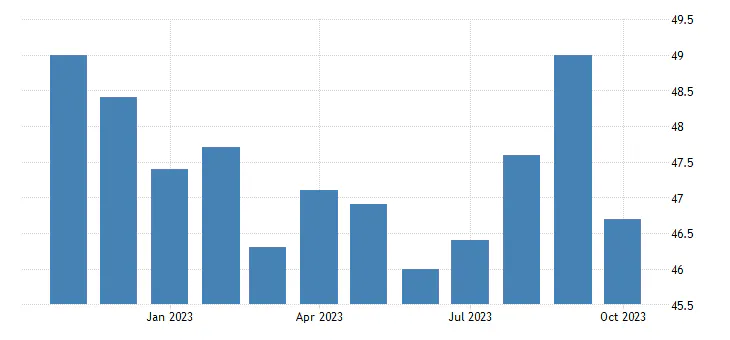
Source: Trading Economics
Fed: Becoming the Market’s Friend?
Later in the day, the FOMC issued its rate decision. The Fed Funds target rate was of course left unchanged at the 5.25-5.50% range, but it was Powell’s generally dovish comments in the Q&A that sent the 10-year rate dropping further. By the evening, after market participants had time to digest the deluge of data and Fed comments, the yield had fallen to 4.7% and stocks were in full-blown rally mode.
Traders now expect four rate cuts next year according to futures pricing, though we’ve seen how unreliable that market can be when projecting the actual path of future Fed policy. Recall in 2020-21 how monetary policy was left too loose, helping to bring about a four-decade high in the CPI rate – the futures market failed to see today’s 5%-plus Fed Funds rate coming with much accuracy on the timing.
Something else to consider: Could the FOMC now be too tight? It’s a key risk we’ll monitor over the coming quarters, and the Fed cannot afford to be so stubborn about reversing policy as they were about turning restrictive early last year. Finally, there would be tremendous political consequences should the Fed be seen as causing a recession during a presidential election year.
Back to the near term, what had been hit hardest over the August through October stretch enjoyed the sharpest relief rallies late last week – Real Estate, Financials, small caps, and long-duration bonds also posted massive gains. The rally was not over.
A Productivity Boom Underway
Following a ‘much ado about nothing’ Treasury refunding announcement earlier in the week, more dovish data was about to hit the tape. Thursday morning’s Nonfarm Productivity report, a preliminary look for Q3, soared to +4.7% - the most efficient pace in three years.
The indicator suggests that workers are getting more done in relatively less time compared to the slack-filled COVID and work-from-home stretch of late 2020 through Q2 of this year. The strong back-to-back productivity gains are seen as easing labor market conditions, a key soft-landing barometer, and something the Fed wants to see play out.
The buying spree pressed on – the 10-year yield fell to just above 4.6%, down a full-quarter percentage point from its high earlier in the week while the chart of risk-on equities progressed further up and to the right. Then Friday’s weak NFP report was the finishing touch, with the 10yr rate dropping to levels not seen since September, though the yield finished significantly off the lows while stocks ended close to the highs of the week.
US Labor Productivity Jumps by the Most in 3 Years
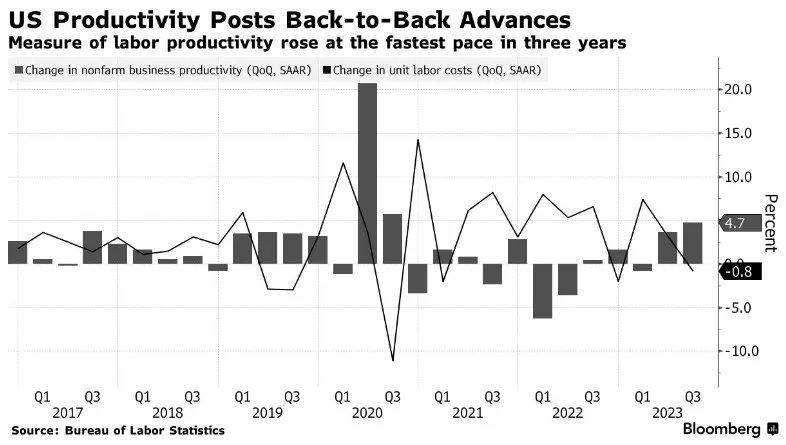
Source: Bloomberg
S&P 500 Profits Topping Estimates, Bearish Q4 Guidance
It wasn’t just economic data that ran the table over the back half of last week. Corporate earnings may have stumbled a bit out of the gates, but they caught their second wind as the calendar flipped to November. Call it a sugar high around Halloween, but the EPS beat rate soared to above 80% (which is fairly unusual) and stock price reactions to quarterly reports have been much more positive lately. Investors’ eyes were on Apple’s (AAPL) Q3 report released last Thursday night, but there was not a whole lot to write home about with it. With somewhat weak numbers out of China and unimpressive year-on-year growth rates on the top and bottom lines, shares sold off initially.
More broadly, FY 2023 S&P 500 EPS is now seen at $221 while out-year estimates are $246. There is more to the story here though. You see, Q3 has indeed verified much better than feared, helping to lift the FY estimate, but Q4 outlooks have been downbeat. Pair those together, and 2023’s EPS forecast is not a whole lot changed from a few months ago. Corporate executives may be trying to set the bar low enough so they can begin 2024 on a seemingly strong note. We call this “sandbagging it” in the analyst community.
Retail Investors and Investment Managers Caught Offside
CEOs and CFOs are not the only ones possibly fearful of what’s to come over the ensuing weeks and months. Each Thursday, I keep tabs on the AAII Bull/Bear sentiment survey. This past week’s bearish percentage climbed to the highest mark since early 2023. That is not surprising given the 3-month correction in the S&P 500 and near-bear market on the Russell 2000.
Plunging bond prices don’t help the feelings of the respondents either. AAII’s pulse of the investor community writ large was about on par with other sentiment gauges like the CNN Fear/Greed Index and the BofA Bull/Bear Indicator. Also, the National Association of Active Investment Managers (NAAIM) Exposure Index showed bearish positioning data – backing up extreme short positions seen among Commodity Trading Advisors (CTAs). Mix all that in with sanguine economic data, a dovish Fed, bullish seasonality (which we talked about last week), and the market had the recipe for explosive gains.
AAII Bearish Percentage History

Source: Liz Ann Sonders, Bloomberg
GOVT Treasury Market ETF: Best Week Since Q1
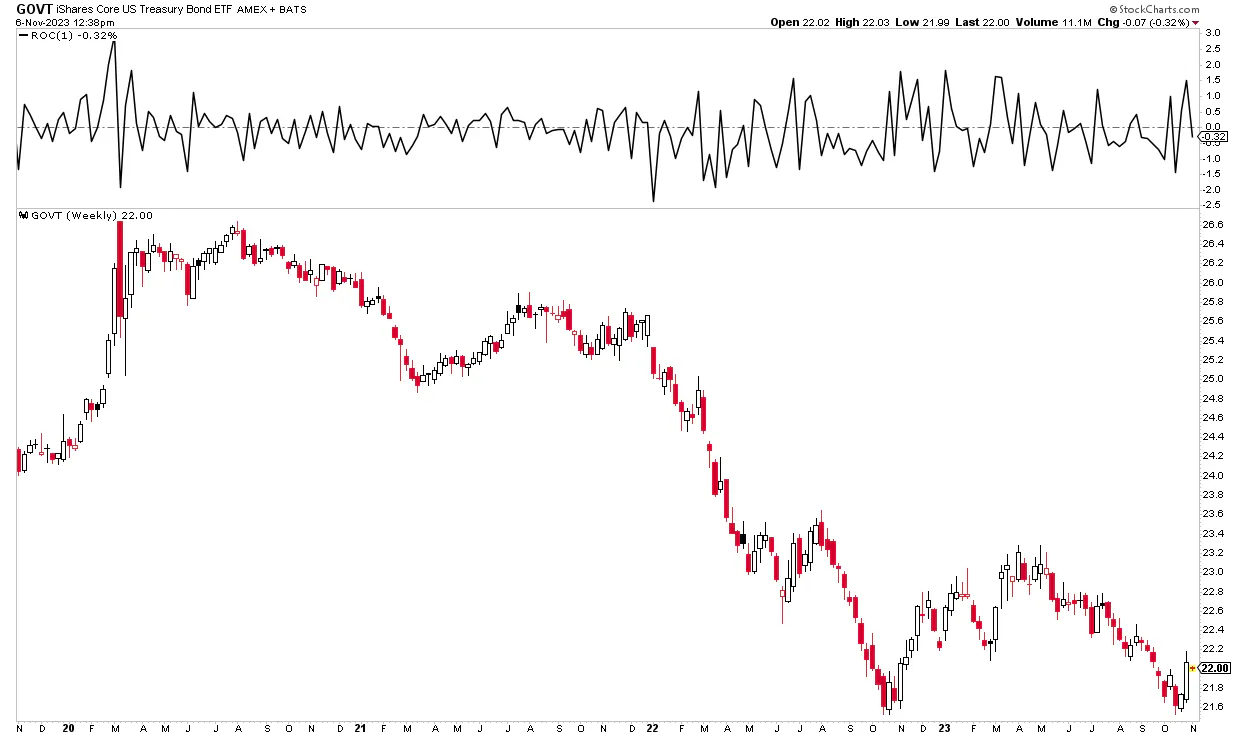
Source: Stockcharts.com
IWM Small Cap ETF: A Whisker From its Best Week Since March-April 2020
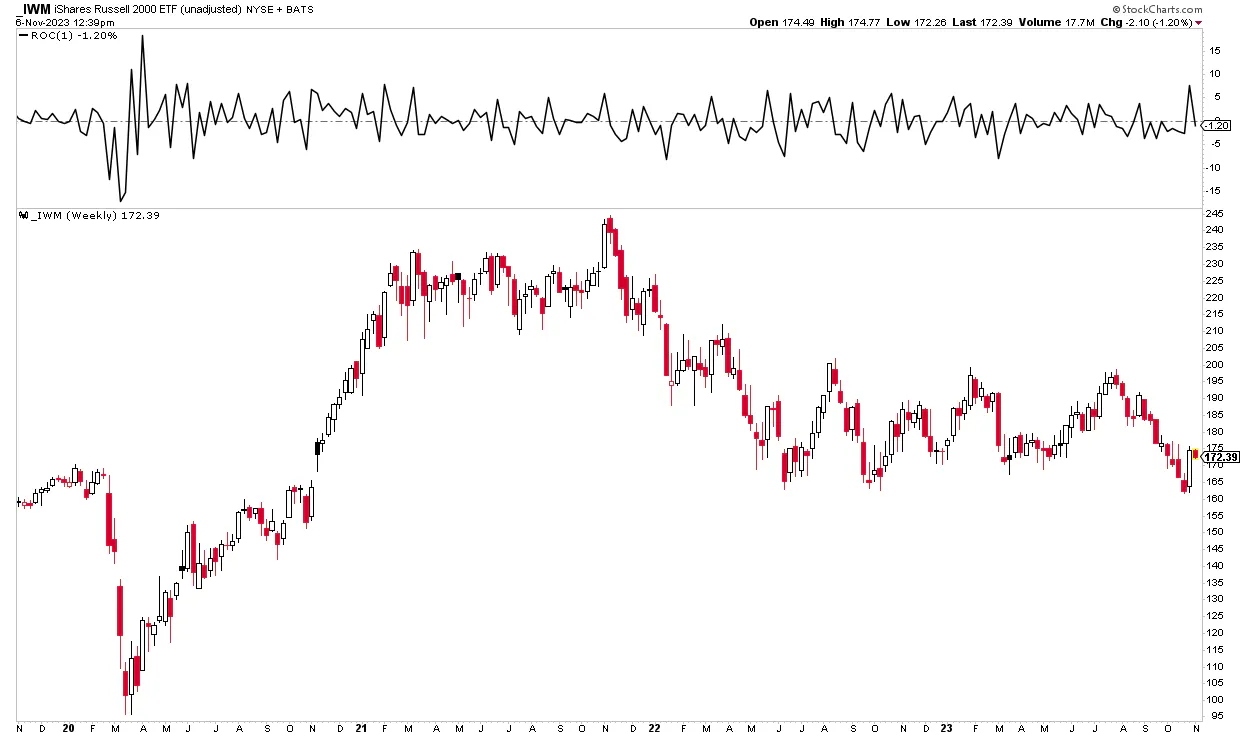
Source: Stockcharts.com
Crude Oil: Weak Economic Data Sends WTI Close to 2-Month Lows
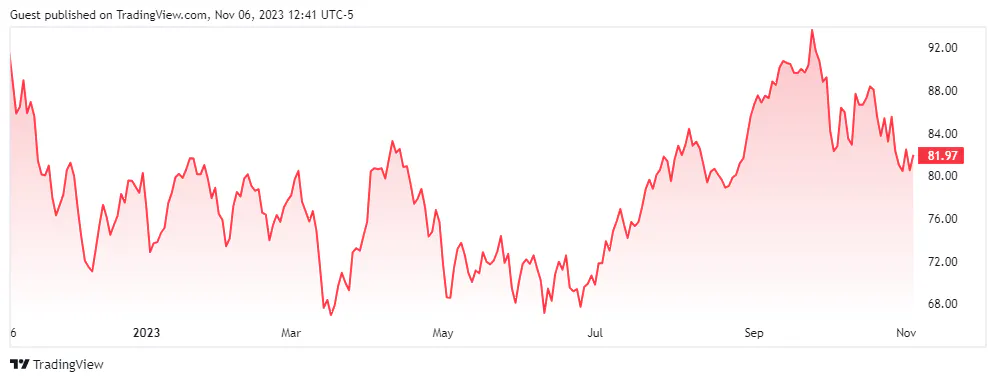
Source: TradingView
The Bottom Line
Last week was what the bulls and doves yearned for. Weak economic data, but nothing ‘too bad,’ keeps the Goldilocks soft-landing scenario in play. Ebbing inflation trends amid a cooling jobs market are ideal and corporate profits continue to be decent. Still, conditions on Main Street can quickly turn south, and we must keep on guard for data that turns overly contractionary.
Want access to your own expert-managed investment portfolio? Download Allio in the app store today!
Related Articles


The articles and customer support materials available on this property by Allio are educational only and not investment or tax advice.
If not otherwise specified above, this page contains original content by Allio Advisors LLC. This content is for general informational purposes only.
The information provided should be used at your own risk.
The original content provided here by Allio should not be construed as personal financial planning, tax, or financial advice. Whether an article, FAQ, customer support collateral, or interactive calculator, all original content by Allio is only for general informational purposes.
While we do our utmost to present fair, accurate reporting and analysis, Allio offers no warranties about the accuracy or completeness of the information contained in the published articles. Please pay attention to the original publication date and last updated date of each article. Allio offers no guarantee that it will update its articles after the date they were posted with subsequent developments of any kind, including, but not limited to, any subsequent changes in the relevant laws and regulations.
Any links provided to other websites are offered as a matter of convenience and are not intended to imply that Allio or its writers endorse, sponsor, promote, and/or are affiliated with the owners of or participants in those sites, or endorses any information contained on those sites, unless expressly stated otherwise.
Allio may publish content that has been created by affiliated or unaffiliated contributors, who may include employees, other financial advisors, third-party authors who are paid a fee by Allio, or other parties. Unless otherwise noted, the content of such posts does not necessarily represent the actual views or opinions of Allio or any of its officers, directors, or employees. The opinions expressed by guest writers and/or article sources/interviewees are strictly their own and do not necessarily represent those of Allio.
For content involving investments or securities, you should know that investing in securities involves risks, and there is always the potential of losing money when you invest in securities. Before investing, consider your investment objectives and Allio's charges and expenses. Past performance does not guarantee future results, and the likelihood of investment outcomes are hypothetical in nature. This page is not an offer, solicitation of an offer, or advice to buy or sell securities in jurisdictions where Allio Advisors is not registered.
For content related to taxes, you should know that you should not rely on the information as tax advice. Articles or FAQs do not constitute a tax opinion and are not intended or written to be used, nor can they be used, by any taxpayer for the purpose of avoiding penalties that may be imposed on the taxpayer.