Updated September 26, 2023

Mike Zaccardi, CFA, CMT
Macro Money Monitor
Market Update
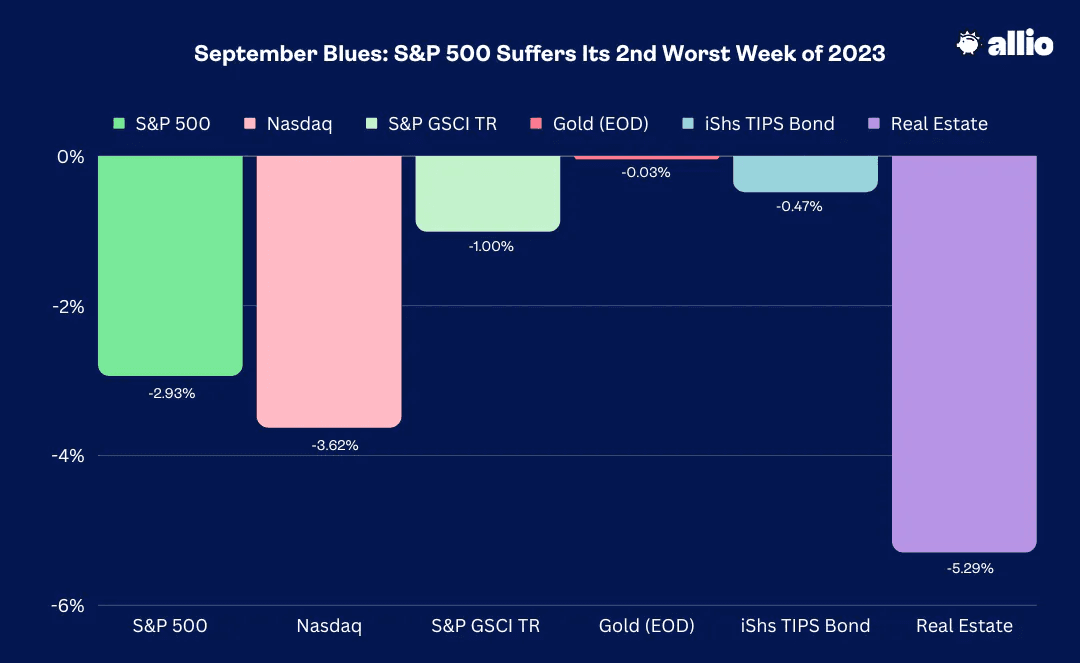
Stocks endured their worst week since March, though the S&P 500 fell less than 3%. Losses were felt a bit harder in the tech space with the Nasdaq Composite dropping 3.6%. A continued rise in Treasury yields finally caught up to many growth equities – Consumer Discretionary was the weakest sector while the defensive Health Care, Utilities, and Consumer Staples areas fared relatively well.
All sectors were in the red, and Real Estate was slammed – the XLRE ETF managed to undercut its March low. Commodities gave back just a small portion of their recent gains amid a risk-off trading atmosphere while gold was roughly flat. The yellow metal’s consolidation is actually somewhat impressive given the steep rise in the dollar and jump in real interest rates over the last several weeks. Inflation-protected Treasuries retreated along with the broader fixed-income selling trend.
September 15, 2023 - September 22, 2023
The Look Ahead
Following a busy stretch on the macro front, next week sees more key data hitting the tape. The focus will again be on the wobbly housing market with a July read of the Case-Shiller Home Price Index Tuesday morning followed by August New Home Sales data and a fresh September Consumer Confidence report. Keep your eyes on Durable Goods numbers, August preliminary figures, Wednesday before the bell as well as Jobless Claims Thursday morning.
We’ll also get a third update on second-quarter GDP which shouldn’t hold too many surprises, but what could get the market nervous would be any hot numbers in the August Personal Income and Spending update on Friday morning. Finally, Chicago PMI for September and a final University of Michigan Consumer Sentiment pulse wrap things up.
On the earnings front, a few big multinationals are in focus. Costco (COST) reports after the close Tuesday, Micron (MU) is Wednesday night, Nike (NKE) posts results Thursday AMC, and Carnival (CCL) quarterly results hit on Friday morning.
‘Do You Believe Me Now?’ The Fed’s Hawkish Hold.
The Federal Reserve delivered about what the market expected last week. Chair Jay Powell and the rest of the FOMC kept their policy rate unchanged while hinting that further tightening could be needed later this year. Perhaps more importantly, the central bank’s voting members erased about 50 basis points of cuts from next year’s outlook.
As it stands, 12 officials expect one more rate increase in 2023 while seven are fine holding the target rate where it is. The median dot-plot projection shows two rate decreases by the end of 2024. Some may have been surprised by the 12-7 committee split, but what moved markets was expectations for next year.
Latest Fed Update Shows Fewer 2024 Rate Cuts

Source: JPMorgan
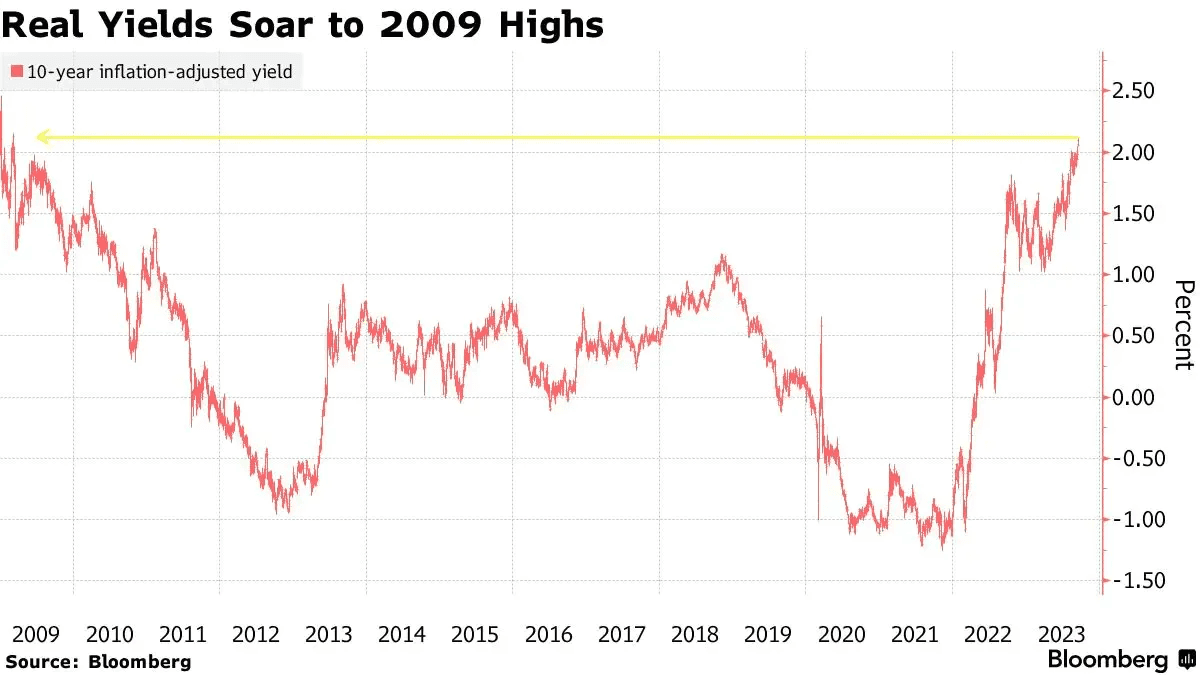
Real Yields Jump Post-Fed
Most investors and Fed watchers are likely about ready to gag if we hear “higher for longer” a few more times, as it has been uttered ad nauseam over the last 12+ months, but lofty interest rates have been further priced into markets. Just take a look at the 10-year real yield on Treasuries. The pivotal gauge on inflation-adjusted rates settled above 2% last week – the highest in 14 years.
A Higher Hurdle Rate
Source: Bloomberg
Traders now see about a 45% chance of a hike at the November 1 Fed meeting with slightly higher chances that the policy rate could be in the 5.5% to 5.75% range after the December gathering. The first cut isn’t priced in until July 2024.
The Bond Bear Market Continues
Along with decade-plus highs in real yields, Treasury rates from the 2-year note to the 20-year bond notched fresh cycle peaks last week. Investors can now camp out in short-term Treasuries and earn better than 5.1% on the 2-year while extending duration to the 5-year note means garnering a lower yield close to 4.6%. The curve has indeed been inverted for a record 213 days, no doubt fodder for the bears as traders navigate through this tough part of the calendar.
Among the many reasons for the ascent in rates is the reality that Treasuries are simply not offering a portfolio diversification benefit. From the late 1990s through 2021, government bonds were seen as a hedge asset. Now that the two asset classes are moving in tandem, investors naturally demand more yield to compensate for the added risk. It’s a hallmark of an inflationary cycle – and this trend shows no signs of halting any time soon.
A Recession Signal? A Record-Long Treasury Rate Curve Inversion

Source: Bloomberg
Ghosts, Goblins, and Bears
With the spooky backdrop of a long-lived rate-curve inversion, the back half of September through early October is likewise often scary. The worst weeks of the year have, on average, taken place this time of year. There are various reasons, such as mutual funds capturing tax losses as they close their books for the year and as strategists lower their outlooks for the Q3 reporting season.
Whatever the narrative, seasonal trends are playing out just as we would expect – and that is not necessarily a bad thing. In fact, it’s normal for volatility to kick up about right now.
Last week, we detailed how “things just got interesting” as market signals had turned more mixed, and uncertainty was on the rise. There are also signs that the soft-landing thesis is on less firm ground, with more data coming in suggesting a rougher landing is not out of the question.
Making the rounds on social media last week was a Google search screenshot underscoring how economists and policymakers initially expected the 2008 Great Financial Crisis to be a mere “soft landing.” While it remains quite possible that the labor market holds firm and consumer spending keeps up, macro price action is poking holes in that notion.
Macro Risks Persist
We continue to see risks such as valuations, rising energy prices, and a broader sense of complacency as crucial factors to consider in the short run. And the thing about October is that it often serves as a market amplifier. Here’s what I mean: The first month of the fourth quarter sometimes sees massive upside reversals, but not before the bulls get smacked in the face.
It’s common for the year-end rally to spark with an October reversal. There are, however, those rare years when significant legs lower in a broader corrective pattern take place. Something the Allio team is watching is institutional positioning and behavior – monitoring those trends will be key as to whether an end-of-year rally is triggered or if the S&P 500’s dip turns into something worse.
Most Year-to-Date Gains Are Gone
Price action beyond large caps is not encouraging, either. Outside of the handful of biggest S&P 500 winners in 2023, equities are roughly flat. An equally weighted version of the S&P 500, the Russell 1000 large-cap equal-weight index, the S&P SmallCap 600, and broader Russell 2000 small-cap index have returned less than Treasury bills year to date. Aesop is smiling as it has been a bit of a Tortoise and the Hare story.
Outside of the US Megacaps, Equity Returns Are No Better Than Treasury Bill Returns

Source: Stockcharts.com
As the Dollar Goes, So Goes the Stock Market?
That’s a lot of squiggly lines to parse through, but maybe all you need to pay attention to is the US Dollar Index (DXY). The greenback’s remarkable 10-week winning streak is its best since 2014. Recall that the dollar peaked in September last year (right about when Barron’s put a flexing George Washington on its cover). Bloomberg would later describe 2022’s beefy dollar move as “can’t stop, won’t stop.” Naturally, such frothy sentiment marked the top, and stocks big and small rallied over the ensuing months.
Small Caps Dip into Correction Territory
Jump ahead to the current quarter, and the bulls have been swimming against the DXY’s current. A rally in the dollar comes alongside the rate rise. It’s not just a tag-team match, either. Perhaps a royal rumble of bearish macro factors is at play now that commodity prices are staging a stout four-month advance. All told, the S&P 500 remains just 6% from its late-July high, though the Russell 2000 has entered official “correction” territory, down 11% from its Q3 peak.
Why is the VIX Still So Low?
Headwinds are many, but volatility traders are not so impressed. Last week, the VIX settled at an unenthusiastic 17 despite the SPX’s worst week in six months. Pressuring stock market volatility has been a gradual easing of bond market volatility – as measured by the MOVE Index. That gauge dropped to lows not seen since early 2022. Another factor keeping the VIX in check is the intra-market dynamic of reduced stock correlations. When one group of the S&P 500 rallies, another may be on the decline. That offsetting nature in recent months has resulted in a seemingly calmer broader market.
Where Are We Not Seeing Risk? Credit Spreads.
Amid so many yellow flags and caution signals apparent today, the credit market suggests the corporate lending environment is just fine. Both investment grade and high yield spreads remain at tempered levels. Typically, when unease is truly felt and bankruptcies could be in the offing, one of the leading indicators of such trouble is a blowout in borrowing costs for corporate paper compared to Treasury yields. With the junk bond market’s yield-to-maturity consolidating near 8.5%, a three-percentage-point premium over default-risk-free government notes is rather sanguine. Did the trend change at all post-Fed last week? Not so much, although the high yield spread bumped up modestly.
Earnings Season on the Doorstep
At the firm-specific level, corporations are battling a myriad of macro conditions that could hurt profitability in the near term. Higher borrowing rates, more expensive equity financing, the dollar’s climb, more costly raw material prices, and workers with strong negotiating power make producing growing profits a challenge. A 0.2% year-on-year dip in S&P 500 aggregate earnings is expected for the quarter about to wrap up.
We are just two weeks from the start of Q3 earnings season. Unlike most years, profit estimates have been modestly on the rise over recent months. Both 2023 and 2024 S&P 500 earnings pictures are more optimistic, despite what appear to be rising macro risks. Executives today are all-stars at turning in EPS gains, and all eyes will soon shift back to top and bottom-line results as well as forward-looking commentary.
The Hope Trade Kicking In
Lastly, as the usual regional Fed survey data comes in (Dallas Fed Manufacturing Monday, Philly Fed Non-Manufacturing Tuesday, among others), there has been a reversal in the so-called “hope” trade. Earlier this year, soft survey data and sentiment gauges were weak while hard data, like retail sales and monthly employment trends, were robust. That story has flipped over the last few months.
The third quarter has seen a modest deterioration in hard data as optimism has sprung up. Sentiment was worst following the collapse of Silicon Valley Bank in March and fears of a redux of a banking crisis. For investors, it’s yet another trend suggesting expectations could be turning too bullish.
The Bottom Line
Stocks dipped further following the so-called “hawkish hold” by the Fed last week. Rising commodity prices may keep headline CPI and PCE above 4% while the jobs market and consumer spending patterns make the Fed’s goal of 2% core inflation all the tougher to achieve. More important data points come this week as traders face the most bearish period of the year.
Want access to your own expert-managed investment portfolio? Download Allio in the app store today!
Related Articles


The articles and customer support materials available on this property by Allio are educational only and not investment or tax advice.
If not otherwise specified above, this page contains original content by Allio Advisors LLC. This content is for general informational purposes only.
The information provided should be used at your own risk.
The original content provided here by Allio should not be construed as personal financial planning, tax, or financial advice. Whether an article, FAQ, customer support collateral, or interactive calculator, all original content by Allio is only for general informational purposes.
While we do our utmost to present fair, accurate reporting and analysis, Allio offers no warranties about the accuracy or completeness of the information contained in the published articles. Please pay attention to the original publication date and last updated date of each article. Allio offers no guarantee that it will update its articles after the date they were posted with subsequent developments of any kind, including, but not limited to, any subsequent changes in the relevant laws and regulations.
Any links provided to other websites are offered as a matter of convenience and are not intended to imply that Allio or its writers endorse, sponsor, promote, and/or are affiliated with the owners of or participants in those sites, or endorses any information contained on those sites, unless expressly stated otherwise.
Allio may publish content that has been created by affiliated or unaffiliated contributors, who may include employees, other financial advisors, third-party authors who are paid a fee by Allio, or other parties. Unless otherwise noted, the content of such posts does not necessarily represent the actual views or opinions of Allio or any of its officers, directors, or employees. The opinions expressed by guest writers and/or article sources/interviewees are strictly their own and do not necessarily represent those of Allio.
For content involving investments or securities, you should know that investing in securities involves risks, and there is always the potential of losing money when you invest in securities. Before investing, consider your investment objectives and Allio's charges and expenses. Past performance does not guarantee future results, and the likelihood of investment outcomes are hypothetical in nature. This page is not an offer, solicitation of an offer, or advice to buy or sell securities in jurisdictions where Allio Advisors is not registered.
For content related to taxes, you should know that you should not rely on the information as tax advice. Articles or FAQs do not constitute a tax opinion and are not intended or written to be used, nor can they be used, by any taxpayer for the purpose of avoiding penalties that may be imposed on the taxpayer.