Updated February 20, 2024

Mike Zaccardi, CFA, CMT
Macro Money Monitor
Market Update
Stocks gave back some ground last week as economic data turned south after a strong early-year run. The S&P 500 retreated just 0.4%, snapping a five-week winning streak, while the Nasdaq Composite fell 1.3%. Information Technology was the worst performer, down 2.5% as some of Magnificent Seven’s luster wears off. Shares of Apple (AAPL) closed under their 200-day moving average – an important technical development for the world’s second largest publicly traded company. Tesla (TSLA) has fared even worse, now down by a third from its 2023 peak near $300.
Still, nine of the 11 S&P 500 sectors managed to outperform the index, with risk-on and cyclical areas such as Energy and Materials posting strong gains. The prompt month of WTI crude oil settled at its best mark since November despite receiving little attention from the financial media. Indeed, the market’s focus has been centered on AI euphoria considering NVIDIA’s (NVDA) meteoric rise and the latest single-stock craze, Super Micro Computer (SMCI), reaching a record-high 1.8% weight in the Russell 2000 Index.
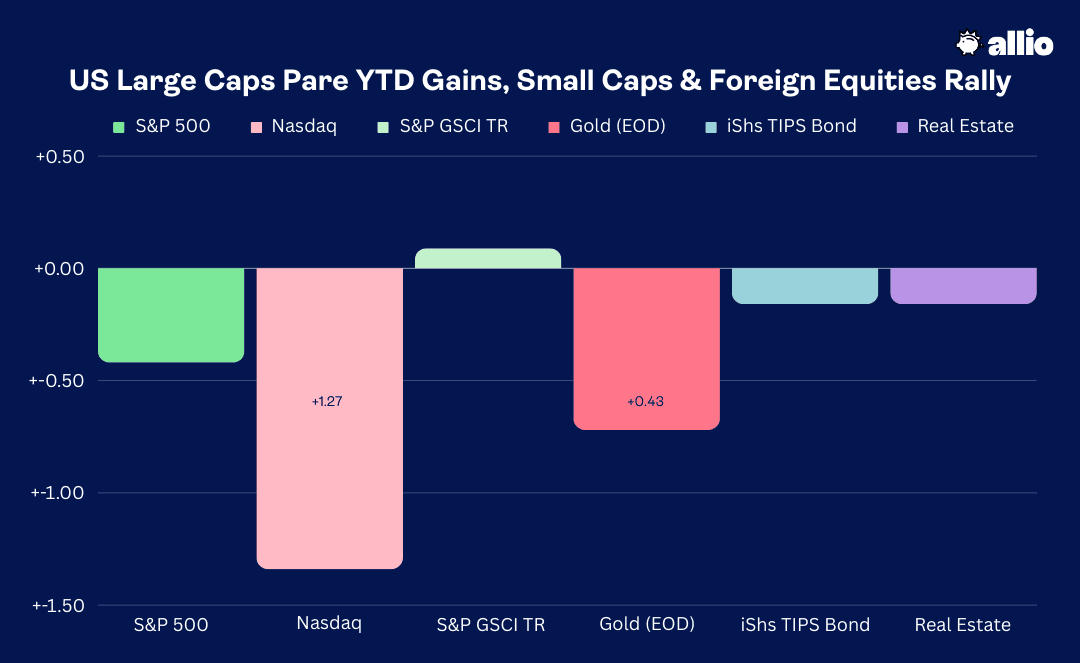
Elsewhere, the Real Estate sector edged lower in the face of rising interest rates once again. Hot inflation readings via the January CPI and PPI reports put the bond market under pressure, leading to higher yields. The TIPS ETF (TIP) was also fractionally down on the week. Gold, unlike oil, endured some selling pressure – rising real interest rates and a strong dollar were bearish factors for the precious metal.
The commodity complex indeed bears watching as we venture further into the back half of Q1 given that the chart of the S&P GSCI Index has turned less negative since the start of 2024. Bigger picture, US small caps and international stocks were positive last week – both of which climbed to fresh 22-month highs as the market’s rally broadened.
For the year, the S&P 500 is up 4.9% and the Nasdaq Composite is higher by 5.1%.
Source: Stockcharts.com
The Look Ahead
The holiday-shortened trading week features a dearth of economic reports. We must wait until Wednesday morning before the macro action kicks in. Ahead of the opening bell on the 21st, MBA Mortgage Applications hit the tape. Following the 10-year Treasury note yield’s uptick, the average rate on a new 30-year fixed-rate mortgage rose to 7.14% last Friday afternoon – the loftiest level since November 30, 2023. As the cost of borrowing creeps up, would-be home buyers will likely stand on the sidelines.
Later in the day, minutes from the January FOMC meeting are released. Expect some volatility at 2 p.m. ET considering that there are clearly varied opinions among the Fed’s voting members regarding the future of the committee’s policy. But with troubling inflation reports for the month of January, the hawks may have the upper hand, leading to potentially fewer interest rate eases in 2024. As it stands, just 90 basis points of cuts are priced into 2024.
Jobless Claims data then crosses the wires at the usual time on Thursday morning. Despite countless corporate layoff headlines to start the year, both initial and continuing claims numbers are little cause for concern. The labor market appears to be good, not great – tight enough for laid-off white-collar workers to quickly find new employment. It’s a situation that bears close watch, however. During the trading session on Thursday, we will get February preliminary PMI numbers from S&P Global.
Both the Manufacturing and Services surveys showed economic improvement last month – the Manufacturing gauge jumped above 50 for the first time since April 2023, marking the best reading since September 2022. As for Services, that barometer benefited from robust New Orders in January, driving the index to its best mark since June 2023. The week wraps up with January Existing Home Sales data, expected to reveal an uptick compared to December, but unfriendly early-year weather has already cast clouds on several demand-related macro data points recently. Lastly, Wednesday and Thursday feature speaking engagements from five FOMC members.
Housing Market Data, FOMC Minutes, S&P Global PMIs, and More Fed Speak

Source: BofA Global Research
Earnings Reports This Week
The fourth-quarter reporting season nears the finish line, but we have another big week to go. So far, 79% of S&P 500 companies have issued results, and the bottom-line beat rate is near the long-term average at 75%. Q4 earnings growth is now seen at 3.2%, though full-year 2024 EPS estimates are steady from a month ago at $243, leading to an S&P 500 P/E ratio slightly above 20x.
Front and center, retailers and consumer companies serve up numbers toward the end of the season. Despite the holiday, Monday afternoon features results from Transocean (RIG) in the Energy sector, but the real action gets underway before trading starts on Tuesday. Walmart (WMT) and Home Depot (HD) provide key insights into consumer spending trends. Their numbers and conference calls will be even more critical to parse through in light of the very soft January Retail Sales report issued last week.
Elsewhere, Medtronic (MDT) in the Health Care sector and Barclays (BCS) from the Financials sector report, too. After the close on Tuesday, Palo Alto Networks (PANW), a major winner this year, hopes to keep its momentum going. Caesars Entertainment (CZR) and Toll Brothers (TOL) are two more Consumer Discretionary companies issuing Q4 numbers.
Wednesday is all about NVDA. Now the third most valuable company by market cap, surpassing both Amazon (AMZN) and Alphabet (GOOG) recently, the Mag-7 standout has a lot to live up to. Shares are up 230% in the last 12 months, rising 47% just since the calendar flipped to 2024, and the options market prices in a 7% earnings-related stock price swing. The chip designer’s data center revenue will be a key metric along with guidance for the current quarter. Rivian (RIVN) and a few Energy-sector firms report then as well. Block (SQ) will be the report to watch on Thursday while Warner Bros Discovery (WBD) and Bloomin Brands (BLMN) report on Friday morning.
Walmart, Home Depot, and NVIDIA Are the Headliners

Source: Earnings Whispers
Topic of the Week: A January Inflation Scare as Consumers Take a Breather
Traders had gotten used to friendly inflation data coming into last week. CPI, PPI, and PCE (the Fed’s preferred gauge) were all comfortably cooling, surely to the delight of the FOMC members. It’s not surprising that stocks have performed so well since October – a Goldilocks soft-landing (or no-landing) narrative was playing out. Interest rates fell sharply as the end of 2023 approached, lifting the risk assets’ prices.
Last month, macro data verified strong. The Citi Economic Surprise Index, something we’ve talked about before, was heating up. Despite a hiccup related to New York Community Bank (NYCB) a few weeks back, concerns began to drift from slowdown fears to perhaps the economy expanding too fast, forcing the Fed to keep its policy rate, dare I say, higher for longer.
But the latest data put a new spin on the macro story. Both the January CPI and PPI reports came in hotter than expected. Interest rates naturally increased on the news and the chance of a March rate cut is now just about off the table. Should we be overly concerned about inflation re-heating? Probably not. The path toward normal levels will of course be bumpy, and in a few months, we may hardly remember the market’s reaction to the news – even the Russell 2000’s steep 4% decline last Tuesday.
January Core CPI Inches Up on a Six-Month Annualized Basis, Driven by Hot Shelter Numbers
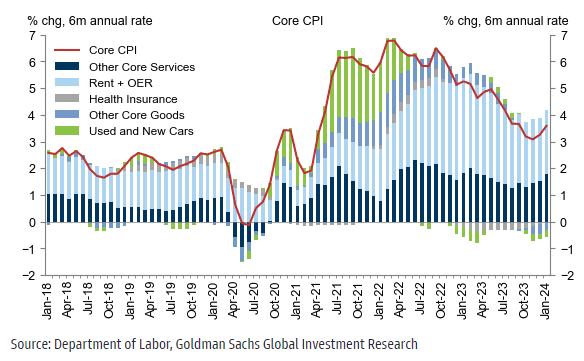
Source: Goldman Sachs Investment Research
Slower Growth in Q1
Still, a trend emerges. Pair strong CPI and PPI prints for January with what was a decisively soft Retail Sales report, and we must be on guard for the risk that a material slowdown in growth is in play while inflation lingers. The US economy expanded at an inflation-adjusted annual rate of 4.9% in Q3 2023 and 3.3% the following quarter. Last Friday, following the disappointing consumer spending figures, BofA lowered its Q1 real GDP growth forecast to just 1.0%. At nearly the same time, economists at Goldman Sachs raised their PCE inflation forecast to 0.43% for January. Amid all that, folks feel upbeat, evidenced by a strong University of Michigan Surveys of Consumers report released Friday last week.
If you flipped on financial TV, you might have heard the term “stagflation” bantered about. It’s way too early to make that bold determination, but slowing growth along with consumer price increases above the Fed’s target would not be an ideal scenario for risk assets.
January Retail Sales Fall 0.8%: Softness Across the Board, Snapping a 9-Month Streak of YoY Gains
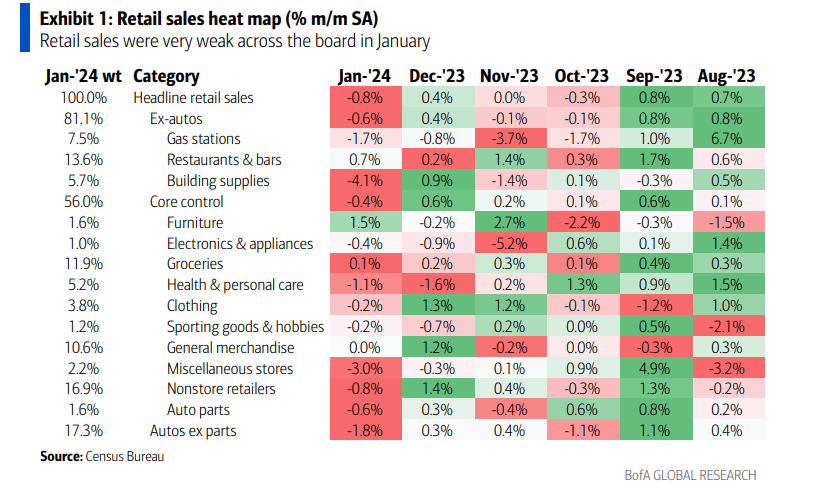
Source: BofA Global Research
Industrials and Financial Paint a Bullish Backdrop
What would be positive, though, is if demand indicators do cool off, so long as inflation readings continue their downward trend. And that is still quite possible. In fact, if we take our macro-economist hats off, we see that price action in the stock market could be telling an encouraging tale. Consider that last week, the cyclical Industrials sector closed at an all-time high. The Financials sector ETF (XLF) - it's up five weeks in a row and at its best weekly mark in more than two years. Small caps caught a bid while value stocks rose to a record level.
It goes to show that as macro conditions shift, the market tends to reshuffle just the same. It’s not a monolith – new areas often come into favor. With attractive valuations among some of these new leading groups, there’s certainly some reason for optimism for diversified global macro investors.
Industrials & Financials Power to New Highs
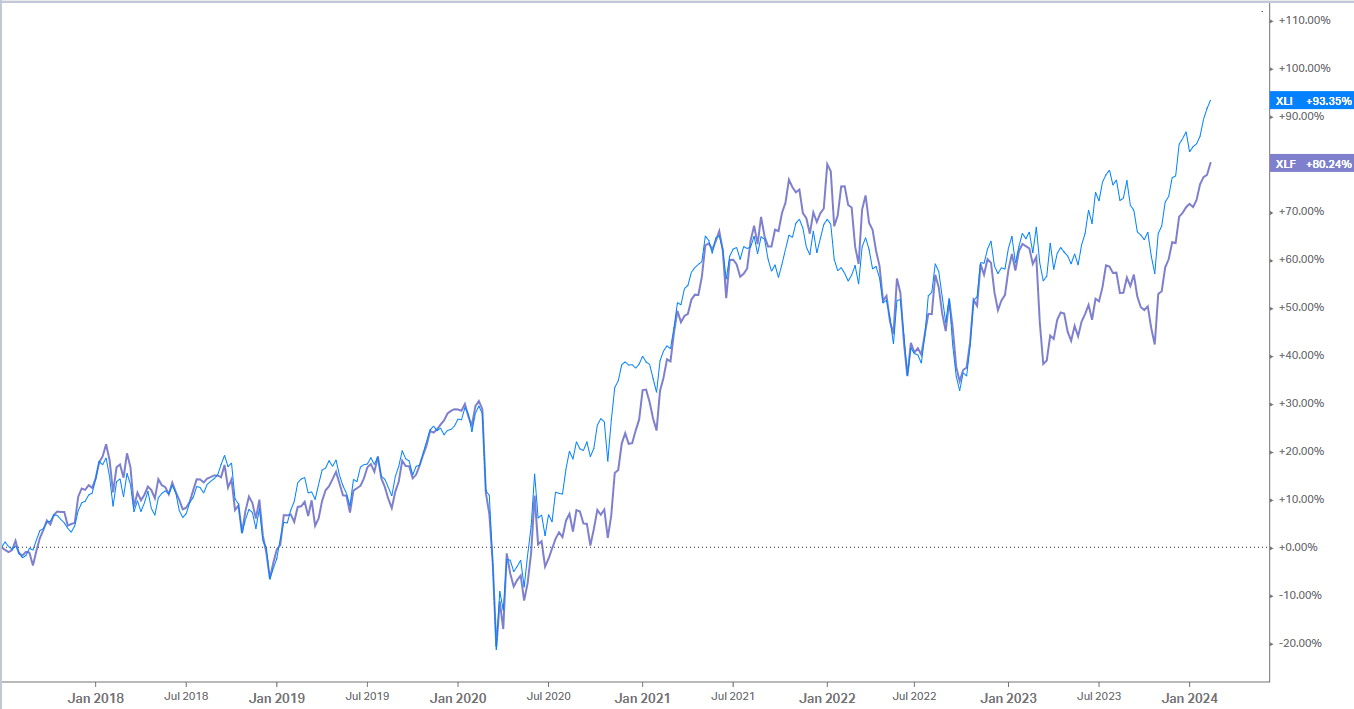
Source: Koyfin Charts
Macro Clues from Price Action in Oil & The Dollar
Still, there are key headwinds. For one thing, crude oil is creeping back up as are gasoline futures. Next week, the more expensive summer blend of wholesale gas begins trading as the front month in the RBOB market. That’s a lot of jargon to detail a basic reality: pump prices will keep rising if nothing else changes. With April RBOB near $2.60, consumers can expect to face average gas prices near $3.50 in the coming weeks, up from a low right near $3 around the turn of the year. Couple that with real wage growth that dipped negative in January, and busy families could face tighter finances as 2024 presses on.
RBOB Gasoline Futures: Highest Prices Since the Fall

Source: TradingView
Stocks Shrug Off a Strong Dollar
Along with more expensive oil prices, the US Dollar Index has climbed every week this year. A stronger dollar is usually problematic for stocks and has often been associated with higher commodity prices and rising interest rates over the past two-plus years. It’s not a favorable macro backdrop if the greenback continues its ascent.
Recall how volatile equities were two years at this time when the US Dollar Index rallied from 95 to 115 – oil surged from under $70 to above $120 while the S&P 500’s bear market was just getting started. To put a butt on it, few strategists are talking about the risks posed by oil and the dollar, but these are key indicators we are monitoring.
US Dollar: Up 7 Weeks in a Row
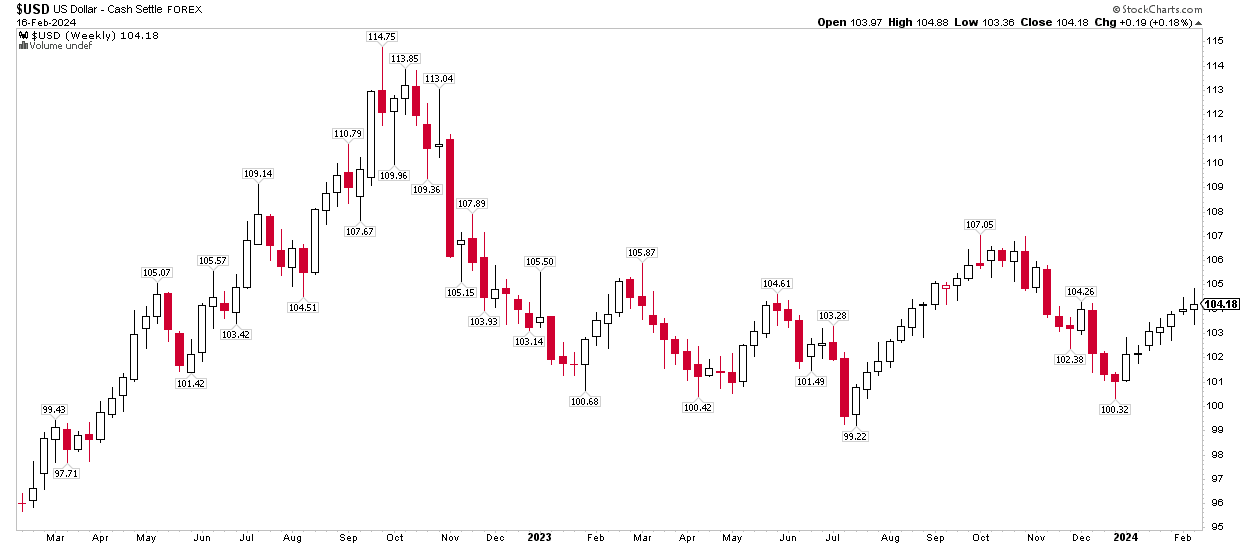
Source: Stockcharts.com
The Bottom Line
January’s hotter-than-expected inflation data, coupled with a weak Retail Sales report, cast some shade on the immaculate-disinflation notion. For now, it is a bump in the disinflation road, but broader macro price action must be monitored as new risks unfold. Diversified investors were rewarded last week, however, as most global stocks rallied despite weakness in the tired Magnificent Seven glamour companies.
Want access to your own expert-managed investment portfolio? Download Allio in the app store today!
Related Articles


The articles and customer support materials available on this property by Allio are educational only and not investment or tax advice.
If not otherwise specified above, this page contains original content by Allio Advisors LLC. This content is for general informational purposes only.
The information provided should be used at your own risk.
The original content provided here by Allio should not be construed as personal financial planning, tax, or financial advice. Whether an article, FAQ, customer support collateral, or interactive calculator, all original content by Allio is only for general informational purposes.
While we do our utmost to present fair, accurate reporting and analysis, Allio offers no warranties about the accuracy or completeness of the information contained in the published articles. Please pay attention to the original publication date and last updated date of each article. Allio offers no guarantee that it will update its articles after the date they were posted with subsequent developments of any kind, including, but not limited to, any subsequent changes in the relevant laws and regulations.
Any links provided to other websites are offered as a matter of convenience and are not intended to imply that Allio or its writers endorse, sponsor, promote, and/or are affiliated with the owners of or participants in those sites, or endorses any information contained on those sites, unless expressly stated otherwise.
Allio may publish content that has been created by affiliated or unaffiliated contributors, who may include employees, other financial advisors, third-party authors who are paid a fee by Allio, or other parties. Unless otherwise noted, the content of such posts does not necessarily represent the actual views or opinions of Allio or any of its officers, directors, or employees. The opinions expressed by guest writers and/or article sources/interviewees are strictly their own and do not necessarily represent those of Allio.
For content involving investments or securities, you should know that investing in securities involves risks, and there is always the potential of losing money when you invest in securities. Before investing, consider your investment objectives and Allio's charges and expenses. Past performance does not guarantee future results, and the likelihood of investment outcomes are hypothetical in nature. This page is not an offer, solicitation of an offer, or advice to buy or sell securities in jurisdictions where Allio Advisors is not registered.
For content related to taxes, you should know that you should not rely on the information as tax advice. Articles or FAQs do not constitute a tax opinion and are not intended or written to be used, nor can they be used, by any taxpayer for the purpose of avoiding penalties that may be imposed on the taxpayer.