Updated December 26, 2023

Mike Zaccardi, CFA, CMT
Macro Money Monitor
Market Update
Stocks finished higher ahead of the holidays and as the vaunted Santa Claus Rally period gets underway. The S&P 500 rose for an eighth straight week, the longest streak since 2017. Gains were once again broad-based with small caps surging 2.6% to settle at their best level since March 2022. While the SPX rose just 0.8%, the Nasdaq Composite returned more than 1% with mixed, but generally favorable, results from the Magnificent Seven stocks.
Indeed, it was the Communication Services sector that led the large-cap index, but Energy also managed to rebound from what has been a somewhat sluggish quarter. Recall that WTI crude oil peaked near $95 at the end of Q3, and while the broad stock market has soared from a low notched on October 27, Energy has produced mediocre returns. All sectors, sans the defensive Utilities niche, posted positive returns last week.
Elsewhere, commodities marched higher by 1.25%. Natural gas got off the mat with a 5.3% gain while global oil prices rose about 3% on the heels of geopolitical tensions brewing in the Red Sea along with concerns over future output from Angola. Gold, meanwhile, was largely out of the spotlight, but the precious metal rose 1.6% to $2069 – its second-best weekly settle of the year.
In the bond market, more sanguine inflation data pressured yields lower. The rate on the benchmark 10-year Treasury note finished at 3.90%, off the lows of the week, but higher bond prices have been correlated with higher stock prices throughout 2023. The theme continued with the aggregate bond index inching higher by 0.14%, though the TIPS ETF was modestly lower last week.
For the year, the S&P 500 is up 23.8% and the Nasdaq is higher by 43.3%.

December 15, 2023 - December 22, 2023
The Look Ahead
It’s a very light week on the economic front. We’ll get an October read on the US housing market with the Case-Shiller Home Price Index on Tuesday morning. Expectations are for a modest acceleration in real estate values, though the reporting period won’t cover the latest dip in mortgage rates. Thursday features a healthy data deck starting with Wholesale Inventories for November, a key gauge that can have a significant impact on the quarterly GDP growth rate. Advance Goods Trade Balance numbers for November also come in the premarket on Thursday, and a hefty trade deficit is the consensus forecast.
We will keep our eye on Initial Jobless Claims on Thursday for any clues on a hiccup in the currently healthy employment market. Also on that morning, Pending Home Sales for November should show a turn higher in transaction activity on a year-over-year basis. The final trading day of 2023 brings with it a December look at the Chicago Purchasing Managers Index – an even 50 is expected, indicating no growth in that region’s manufacturing sector. No major corporate earnings reports hit next week following disappointing numbers from both FedEx (FDX) and Nike (NKE) last week.
This Week’s Data Deck: Case-Shiller, Jobless Claims, Pending Home Sales, Chicago PMI

Source: BofA Global Research
Topic of the Week: Toasting to a Bullish 2023
It has been a holly jolly end to the year. We are now in the heart of the Santa Claus Rally period – the final five trading days of the year and the first two sessions of the new year. You might not think that this sleepy time on Wall Street matters much, but history shows that the following year’s performance appears to be dictated by whether Santa shows up for investors or not.
Consider that when there’s a positive return during this 7-day window, the S&P 500 is higher the next year 72% of the time with an average gain of more than 10%. When we see a negative SPX performance in this window, the new year tends to fare significantly worse, with a mere 5% average total return, according to data from Ryan Detrick. Thus, while the week between Christmas and New Year’s can be a nice break from the usual torrent of economic and corporate event news, price action still matters.
So, What Happened Last Wednesday?
And we saw some strange volatility at times last week. This past Wednesday afternoon reminded investors that markets don’t go up in straight lines for very long. A sharp 1.5% bearish reversal took place on seemingly no fundamental news. Market pundits pinned the move on so-called “0DTE” options (zero days to expiration), or stock options that expire on the same day they are created. What happens mechanically in these situations is that heavy put option buying leads to forced selling in the underlying index.
Bloomberg noted that the 4755 and 4765 SPX option strikes were particularly targeted. Institutional traders are often required to hedge their portfolios, and occasionally when there are significant volatility spikes with plunging stock prices, selling can beget more selling as option sellers must hedge their positions in the futures markets. Furthermore, momentum traders might then pounce on the opportunity to short the market, fueling the plunge. 0DTE option trading volume last Wednesday was reportedly the highest since October.
There’s Always a Reason...
Now, we should take a step back here. The financial media likes to spin a good story, and 0DTE options may have been just the scapegoat for a number of technical reasons why equities pared December gains last Wednesday. Tax-loss selling among the retail crowd can happen about this time along with mutual funds window-dressing their allocations before December 31. Keep in mind that the pullback only brought the SPX back to where it was a week earlier. Also important from a technical lens is that there was no evidence of a follow-through in bearish activity on Thursday and Friday.
The blip in the rally was simply a footnote to yet another strong week on Wall Street, though it does rekindle the debate over whether 0DTE options are a helpful price-discovery mechanism in markets. Additionally, fears of the early 2018 “volmageddon” were renewed, a tumultuous, though short-lived, correction that came about when option-selling strategies blew up (see the XIV and SVXY ETF sagas). Could history repeat itself sooner rather than later? Amid this low-volatility environment and with investors who have suddenly turned quite sanguine on stocks, the risk is rising.
Bullish Holiday Tidings
Speaking of investor sentiment, what a difference two months and, more importantly, higher prices make. They say that Wall Street is the only place where ‘shoppers’ run for the hills when items (stocks) go on sale. Then, when dust settles, and volatility ebbs, investors turn giddy. We have seen that play out in a few different surveys and positioning indicators.
The usual AAII Bull-Bear survey, a report we reference regularly, turned even more upbeat last week. With 52.9% of respondents to the bullish side of the ledger, it’s the highest percentage in almost three years while the 20.9% four-week moving average of bearish sentiment is the tamest since Q2 2021. Moreover, the NAAIM Exposure Index surged from an already-high 78 to a nosebleed-level 97.3 in the latest reporting period. Finally, Bank of America’s monthly Global Fund Manager Survey revealed that portfolio managers are the most overweight stocks relative to cash since January of 2022 – shortly after the S&P 500 hit its all-time high.
Money Managers Jump Back into Stocks, Pull from Cash

Source: BofA Global Research
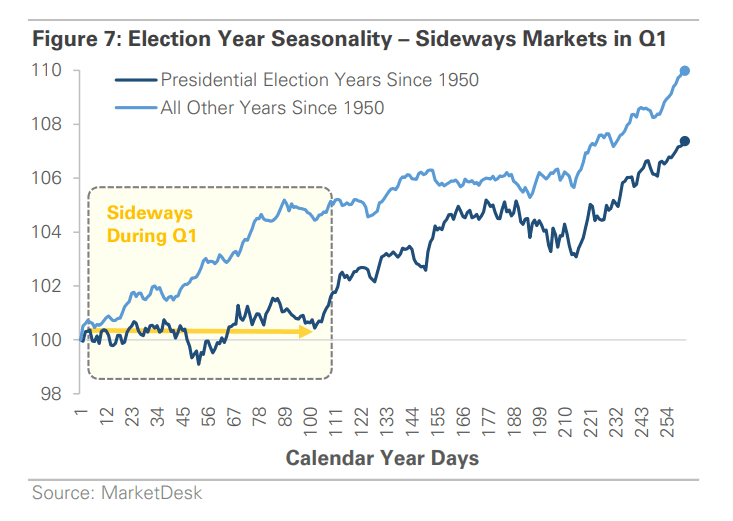
The Presidential Election Cycle: Bullish Year 3, Uncertain Election-Year Beginnings
Again, expectations may have to be toned down. The data backs up that assertion – the first quarter of Presidential election years are historically shaky. Since 1950, the S&P 500 has tended to struggle through the initial months of the year, returning next to nothing when aggregating all “Year 4s.”
Apparently, it’s only after we have a good beat on who the respective party nominees will be that investors feel more confident. To throw more logic to what the stats show, primary campaigns are when candidates aim to appeal to the most extreme wings of each party, which might spook Wall Street. Recall the policies of Bernie Sanders and Elizabeth Warren back on the campaign trail in 2020. The first few months of that year were volatile, but stocks soon rose once the tickets had been finalized.
Be Prepared for Early-Year Unease as Campaign 2024 Heats Up
Source: MarketDesk
Have Stocks Brought Forward 2024 Gains?
No matter how you slice it, political headline risks likely only grow from here since half the planet heads to the polls in 2024. The good news for the bulls is that Wall Street’s expectations are apparently not all that high for next year. As it stands, among 20 high-profile sellside strategists and banks, the average 2024 year-end target is 4861, just 2.2% above last Friday’s closing level on the S&P 500.
Earnings are expected to rise between 6% and 12% depending on whether you ask top-down or bottom-up forecasters. The bar is elevated on the profitability front, and the V-shaped equity market rally that has taken place since October 27 may have pulled forward a sizable chunk of next year’s potential gain. The bulls can also point to strong historical returns in Year 4 of the election cycle after 10%+ rallies in Year 3s, though.
Modest Implied Gains for Stocks Next Year, According to Wall Street Forecasters

Data Source: Bloomberg
November PCE: The Fed’s Getting its Inflation Wish
Helping to fuel the rally over the past two months are both improving economic data, particularly on the inflation front, and simply that there’s so much cash on the sidelines ($8.2 trillion in money markets globally per Goldman Sachs).
Last week, the Fed’s preferred inflation gauge, Core PCE, rose by just 0.1%. On a year-on-year basis, prices are higher by just 3.2% - the lowest since March 2021. Headline PCE actually ticked negative in November, the first red print since April 2020, helping to drive the six-month annualized inflation rate back to the Fed’s 2% target. The bulls claimed victory on Friday when the data crossed the wires, but don’t expect any celebrations from the Fed just yet.
Some FOMC jawboning lately has perhaps been meant to cool off feverish sentiment. It’s hard to stop the impacts of the wealth effect, however. Americans are significantly wealthier today compared to several years ago, and that feeling, along with overall looser financial conditions versus the summer, could result in inflation not sticking at the 2% level for very long. Maybe that’s the major year-ahead risk.
November PCE Inflation Data: Easing Consumer Price Increases
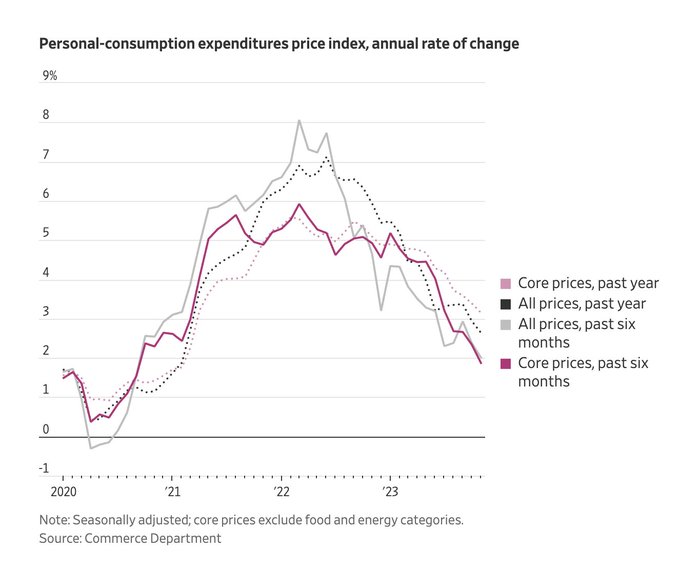
Source: The Wall Street Journal
Futures Market Homes in on 6 Cuts Next Year
Nevertheless, bond traders didn’t back away from their very dovish view on where the Fed’s policy rate will be one year from now. The CME’s FedWatch Tool shows six quarter-point cuts over the next 12 months, with the first ease likely happening at the March 20 FOMC gathering. It is more likely that perhaps four cuts happen in 2024 given that Fed Funds futures are primarily used for hedging (thus they have a downward bias to what the forward policy rate will be). Either way, a soft landing is clearly priced in.
As real interest rates decline, though, the more the Fed will inherently be in restrictive territory. It will continue to be a challenging balancing act for Chair Powell and the committee to bring its monetary policy actions in line given uncertainty on both the inflation front and where real GDP growth will be in 2024.
The Bottom Line
Santa is making quite an appearance on Wall Street. Stocks are up big this month, and the next handful of trading sessions could offer clues on what’s in store for 2024. Recent inflation data was encouraging, and investors remain upbeat, though last Wednesday afternoon’s selloff reminds us that volatility can strike without warning.
Want access to your own expert-managed investment portfolio? Download Allio in the app store today!
Related Articles


The articles and customer support materials available on this property by Allio are educational only and not investment or tax advice.
If not otherwise specified above, this page contains original content by Allio Advisors LLC. This content is for general informational purposes only.
The information provided should be used at your own risk.
The original content provided here by Allio should not be construed as personal financial planning, tax, or financial advice. Whether an article, FAQ, customer support collateral, or interactive calculator, all original content by Allio is only for general informational purposes.
While we do our utmost to present fair, accurate reporting and analysis, Allio offers no warranties about the accuracy or completeness of the information contained in the published articles. Please pay attention to the original publication date and last updated date of each article. Allio offers no guarantee that it will update its articles after the date they were posted with subsequent developments of any kind, including, but not limited to, any subsequent changes in the relevant laws and regulations.
Any links provided to other websites are offered as a matter of convenience and are not intended to imply that Allio or its writers endorse, sponsor, promote, and/or are affiliated with the owners of or participants in those sites, or endorses any information contained on those sites, unless expressly stated otherwise.
Allio may publish content that has been created by affiliated or unaffiliated contributors, who may include employees, other financial advisors, third-party authors who are paid a fee by Allio, or other parties. Unless otherwise noted, the content of such posts does not necessarily represent the actual views or opinions of Allio or any of its officers, directors, or employees. The opinions expressed by guest writers and/or article sources/interviewees are strictly their own and do not necessarily represent those of Allio.
For content involving investments or securities, you should know that investing in securities involves risks, and there is always the potential of losing money when you invest in securities. Before investing, consider your investment objectives and Allio's charges and expenses. Past performance does not guarantee future results, and the likelihood of investment outcomes are hypothetical in nature. This page is not an offer, solicitation of an offer, or advice to buy or sell securities in jurisdictions where Allio Advisors is not registered.
For content related to taxes, you should know that you should not rely on the information as tax advice. Articles or FAQs do not constitute a tax opinion and are not intended or written to be used, nor can they be used, by any taxpayer for the purpose of avoiding penalties that may be imposed on the taxpayer.