Updated November 20, 2023

Mike Zaccardi, CFA, CMT
Macro Money Monitor
Market Recap
Stocks jumped for a third straight week as the November rebound rolls on. The S&P 500 rallied 2.2% while the Nasdaq Composite outperformed just modestly with a 2.4% advance.
The real strength was among small and mid-cap stocks – the beaten-down Russell 2000 enjoyed its second-best week in the last 13 months (the best being its performance two weeks prior). Another move lower in Treasury rates helped many yield-sensitive niches, including the Real Estate space which was the top-performing among the 11 sectors.
The US Dollar and interest rates have been moving together lately, and the 10-year Treasury note yield’s drop under 4.5% came alongside a bearish technical move in the greenback. That combination helped gold once again sneak a peek at the $2000 mark while the broader commodity index finished in the red.
Oil suffered a 1.5% decline to fall into technical bear-market territory off its high above $95 in late September, though “Texas Tea” finished well off the week’s low.
For the year, the S&P 500 is up 17.6% and the Nasdaq is higher by 35%.

November 10, 2023 - November 17, 2023
The Look Ahead
The holiday week offers a respite in economic data, but there are a handful of key reports macro investors should keep an eye on. Monday is quiet, but Tuesday features Existing Home Sales data for October. Another real estate read comes on Wednesday with the weekly update on MBA Mortgage Applications which ticked higher in the most recent report. October’s Durable Goods dataset will likely move the futures market the morning before Thanksgiving. Jobless Claims data comes a day earlier than usual due to the holiday.
Also on Wednesday, the final read of the University of Michigan’s Surveys of Consumers could show significant inflation expectation shifts given the recent fall in retail gas prices – something the Fed pays close attention to. Speaking of the Fed, FOMC Minutes hit the tape at 2 p.m. ET before traders take off for the holiday. Friday’s NYSE half-day features a preliminary November look at S&P Global US Manufacturing and Services PMI data. The good news? No Fed Speak due to the holiday week.
This Week's Data Deck: The Focus Will Be On Existing Home Sales, Jobless Claims, Durable Goods, FOMC Minutes, and PMIs

Source: Credit Agricole
Earnings Reports This Week
The bulk of third-quarter S&P 500 earnings is in the books, but there are a handful of impactful quarterly reports this week. The highlight is undoubtedly NVIDIA (NVDA). The chip designer’s Q3 results post Tuesday after the bell, and the options market has priced in a nearly 7% implied stock price swing.
The Information Technology sector will surely take its cue from NVDA, but Q3 numbers from members of the Consumer Discretionary sector continue to roll in. Kohl’s (KSS), Lowe’s (LOW), Best Buy (BBY), Baidu (BIDU), Abercrombie & Fitch (ANF), DICK’s Sporting Goods (DKS), American Eagle Outfitters (AEO), Nordstrom (JWN), Urban Outfitters (URBN), and Guess (GES) cap off the retail earnings period. Elsewhere, Zoom (ZM), HP (HPQ), and John Deere (DE) report.
NVIDIA and Retailers In Focus
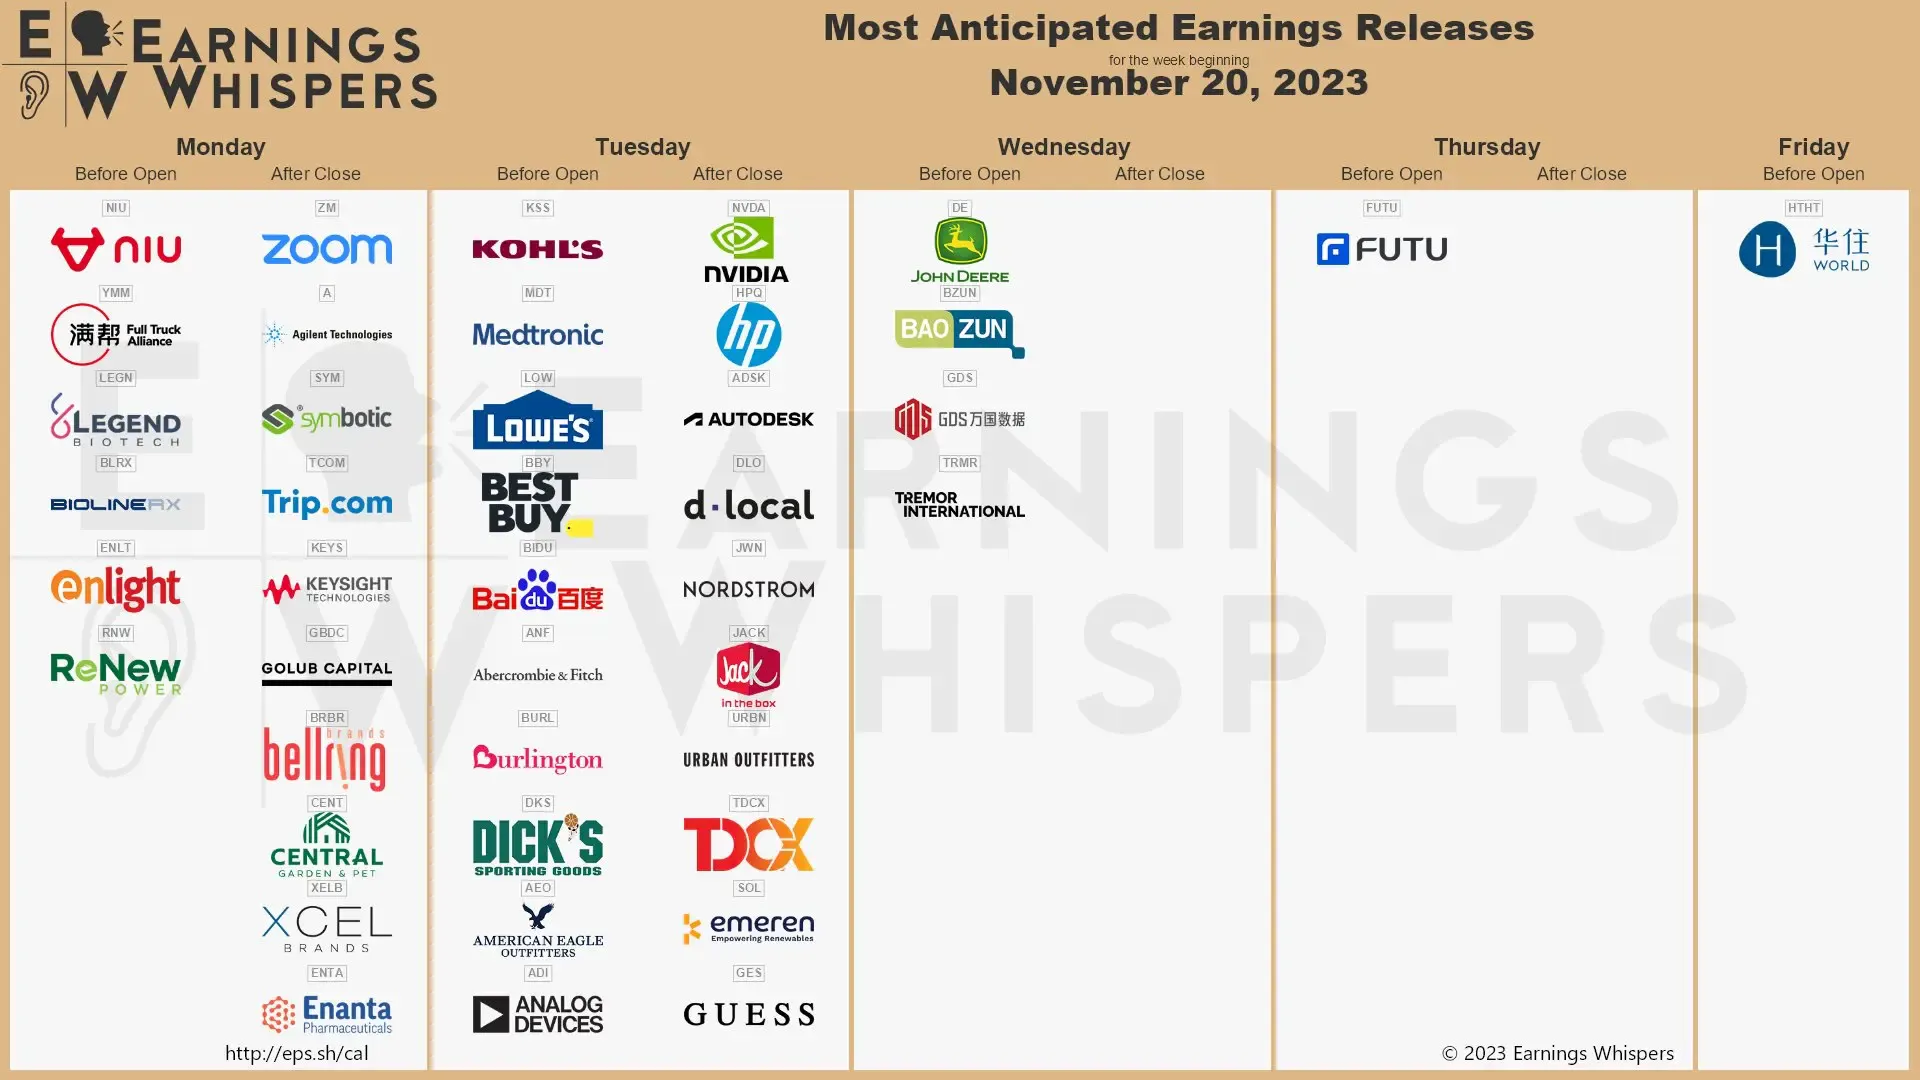
Source: Earnings Whispers
Topic of the Week: Inflation - Stick a Fork in It.
Atop the Fed’s Christmas wish list is inflation closer to the 2% target. Last week’s CPI and PPI data both came in cooler than expected. First, Tuesday’s CPI report was weaker across the board, though it was only a few basis points under what economists were expecting.
The monthly Headline rate printed a goose egg – something we mentioned was a possibility last week given trends in oil and gasoline prices and with some food prices turning negative from year-ago levels. Core CPI, which removes the volatile food and energy components, came in a tenth of a percentage point under what economists were expecting. At 0.2% for October, the annualized Core rate is within earshot of the Fed’s target.
On a year-over-year basis, Headline CPI is now 3.2%, down from 3.7% in September and the lowest since this past June, while Core CPI is 4.0%, the softest since September 2021, down from 4.1% in the previous month. Within the report, real average hourly earnings jumped to +0.8% over the past year, though real average weekly earnings were flat.
Headline & Core CPI Trends: Edging Closer to 2%

Source: St. Louis Federal Reserve
The Core CPI ex-Shelter Rate Declines in October

Source: St. Louis Federal Reserve
Markets Give Thanks
Equities roared following the dovish report. Stocks across sectors and market caps jumped, with some of the worst-performing year-to-date areas shooting higher. Bonds, meanwhile, also caught a big-time bid across the credit-risk and duration spectrums. Best in Show goes to the Russell 2000, though.
Small caps surged 5.5% on Tuesday, the group’s second-best session since the volatile period in March and April 2020. What’s more, the Russell 2000 ETF (IWM) outpaced the S&P 500 ETF (SPY) by about 3.5 percentage points on CPI Day – among its best relative gains since the Great Financial Crisis. For the week, small caps rose 5.4%, an alpha of 3.2% compared to SPY – its best performance versus large caps since early last year.
PPI & Retail Sales Confirmed the Inflation Slowdown
The excitement was not done as CPI was the first of three crucial inflation barometers. Wednesday featured October PPI and Retail Sales data.
Prices at the wholesale level, like CPI, surprised to the downside. Final Demand PPI verified sharply negative last month at –0.5%, resulting in a year-over-year figure of just 1.3% compared to 2.2% in September and an expected 1.9% climb. PPI ex-Food and Energy (comparable to a ‘core’ rate) was flat from September to October and positive by 2.4%, significantly lighter than what economists had projected. So, all good news there.
As for Retail Sales, according to the Census Bureau, October consumer spending cooled. At long last, the pace of very hot Retail Sales reports eased to –0.1%, but that was ahead of the –0.3% forecast. Moreover, revisions to September’s report were higher. Nevertheless, the Retail Sales Control Group’s climb of just 0.2% was considerably below the growth trend from July through September, helping to put to rest the hot-inflation narrative. Walmart’s CEO Doug McMillon echoed that sentiment, even mentioning some deflationary trends in WMT’s Q3 earnings report conference call.
Going Cold Turkey on Further Rate Hikes
It was a lot to digest, but equities finished positive on Wednesday and the Fed Funds futures market squashed any remaining chances for an additional policy rate increase. The focus now shifts to rate cuts. As it stands, bond traders price in a 28% probability of the first decrease coming at the March 20 meeting. As Wall Street strategists publish their 2024 outlook and macro predictions, a total of four quarter-point cuts by December 18 is the market’s expectation.
Weighing the Possible Outcomes
There is nuance to the rate outlook - it’s effectively the weighted average of several possibilities. If economic data is healthy, such as monthly job growth of 100k or more and decent consumer spending levels, then Chair Powell and the rest of the voting members may indeed keep the policy rate ‘higher for longer,’ and short-term yields will be north of 5%.
If, however, data continue to trend worse, we could see cuts sooner rather than later. Furthermore, the Fed now has plenty of room to slash rates in the event of a major unforeseen demand shock. Just take a look at what UBS strategists forecast next year – they predict 275 basis points of easing, with the first cut happening in March.
We see it playing out in either of those two scenarios – the Fed either holding rates at an elevated level or enacting more cuts than what’s currently seen on the CME FedWatch Tool. Could we be on the golden path to price stability while avoiding significant economic trauma? Absolutely, but policymakers must keep a close eye on growth shifts now that the short-term inflation situation has clearly improved.
The Dollar & Yields Tick Down, Bullish for Stocks
Elsewhere last week in terms of price action, key moves were made in both the US Dollar Index and the 10-year Treasury yield. The former broke below a key support area in the 105 to 105.50 range. The greenback’s pullback is seen as a tailwind for risk assets, and a further move lower in the dollar would help stocks continue their year-end rally.
It’s important to note that the final two weeks of November are usually strong. Choppy price action tends to take place over the first half of December before cheery seasonality, not to mention the Santa Claus Rally, gets going. If that historical trend plays out, then the S&P 500 stands a solid chance of notching new all-time highs this year.
US Dollar Index Falls Below 105 – A Bullish Macro Catalyst
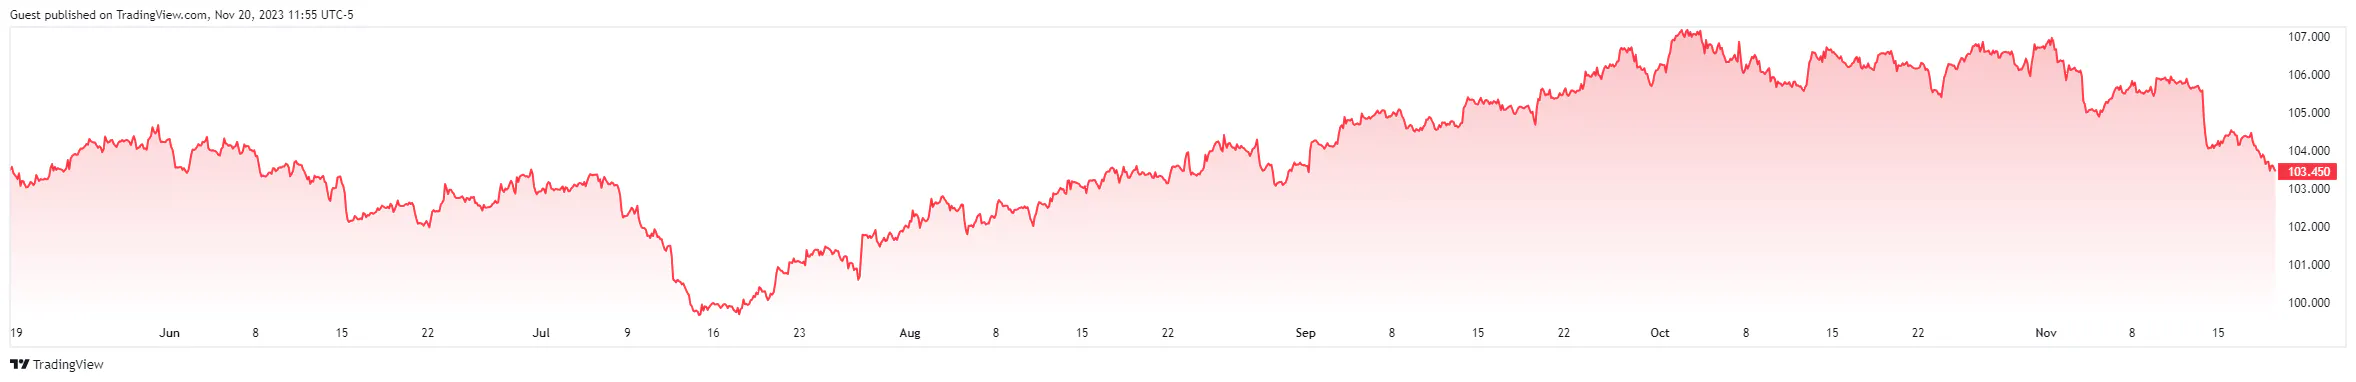
Source: TradingView
The Technical Take on the 10-Year
In terms of rates, the 10-year yield caught technicians’ attention with a breakdown under a key support area. In what is termed a head and shoulders top, a further retreat in yields – possibly to 4% - would seem to be helpful for stocks. But are correlations about to change? From a macro perspective, the stock-bond correlation, which has been positive since inflation fears moved to the forefront several quarters ago, would likely reverse as concerns shift to the economic growth outlook.
For instance, if we see a negative payrolls print on Friday next week, then I would expect stocks to trade lower and bonds to catch a bid – continuing jobless claims are already at the highest level in two years. Maybe we are not quite at that point in the growth slowdown but be on the lookout for good news to be good news for stocks and bad news to once again be bad news.
US 10-Year Treasury Rate Drops Below 4.5%

Source: Stockcharts.com
GDP Growth Steadies
Though it is unknown how asset prices will react to ebbs in economic data, it’s apparent that Q4 will be a significant slowdown from Q3’s monster 4.9% annualized quarterly growth rate. The Atlanta Fed’s GDPnow model pegs the current quarter’s expansion pace at just 2.0% - good but no longer overheated. The St. Louis Fed’s Real GDP Nowcast shows about the same (+2.05%) while the Wall Street consensus rate remains under both of those Fed model figures.
Q4 US Real GDP Growth Expected to Slow Compared to Q3’s 4.9% Rate
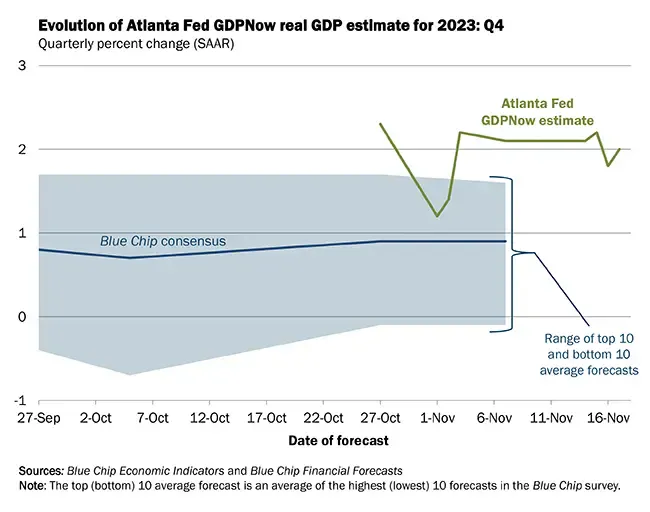
Source: Atlanta Federal Reserve
A Housing Market Upturn?
Something to watch over the coming weeks is how the real estate market and prospective home buyers react to what has effectively been a half-point cut across much of the yield curve. Just last week, MBA Mortgage Application volume for the previous period ticked higher as the typical 30-year fixed-rate mortgage eased. We’ve also seen a move higher in pending home sales, housing starts, and building permits. Some leading economic indicators in the real estate market suggest even a minor giveback in borrowing costs could lead to a sudden rebound in the housing market, which represents 17% of the US economy.
The Bottom Line
Is inflation dead? Americans say no, but recent data suggest the Fed might want to turn its attention to how the growth story unfolds. Amid a light holiday week, markets continue to assess the new reality that the Fed is done hiking rates. We will monitor how stocks and bonds move in response to any weak data points as the S&P 500 creeps closer to fresh highs.
Want access to your own expert-managed investment portfolio? Download Allio in the app store today!
Related Articles


The articles and customer support materials available on this property by Allio are educational only and not investment or tax advice.
If not otherwise specified above, this page contains original content by Allio Advisors LLC. This content is for general informational purposes only.
The information provided should be used at your own risk.
The original content provided here by Allio should not be construed as personal financial planning, tax, or financial advice. Whether an article, FAQ, customer support collateral, or interactive calculator, all original content by Allio is only for general informational purposes.
While we do our utmost to present fair, accurate reporting and analysis, Allio offers no warranties about the accuracy or completeness of the information contained in the published articles. Please pay attention to the original publication date and last updated date of each article. Allio offers no guarantee that it will update its articles after the date they were posted with subsequent developments of any kind, including, but not limited to, any subsequent changes in the relevant laws and regulations.
Any links provided to other websites are offered as a matter of convenience and are not intended to imply that Allio or its writers endorse, sponsor, promote, and/or are affiliated with the owners of or participants in those sites, or endorses any information contained on those sites, unless expressly stated otherwise.
Allio may publish content that has been created by affiliated or unaffiliated contributors, who may include employees, other financial advisors, third-party authors who are paid a fee by Allio, or other parties. Unless otherwise noted, the content of such posts does not necessarily represent the actual views or opinions of Allio or any of its officers, directors, or employees. The opinions expressed by guest writers and/or article sources/interviewees are strictly their own and do not necessarily represent those of Allio.
For content involving investments or securities, you should know that investing in securities involves risks, and there is always the potential of losing money when you invest in securities. Before investing, consider your investment objectives and Allio's charges and expenses. Past performance does not guarantee future results, and the likelihood of investment outcomes are hypothetical in nature. This page is not an offer, solicitation of an offer, or advice to buy or sell securities in jurisdictions where Allio Advisors is not registered.
For content related to taxes, you should know that you should not rely on the information as tax advice. Articles or FAQs do not constitute a tax opinion and are not intended or written to be used, nor can they be used, by any taxpayer for the purpose of avoiding penalties that may be imposed on the taxpayer.