Updated October 30, 2023

Mike Zaccardi, CFA, CMT
Macro Money Monitor
Market Recap
It was another risk-off week as the S&P 500 fell 2.5% to 5-month lows, dropping below key support levels on the chart. Utilities was the only sector to finish in the black while Energy and Communication Services each plunged more than 5%. The Nasdaq Composite underperformed the SPX with a 2.6% decline – key earnings reports were decent, but price action told a different story. We’ll hear from another of the Magnificent Seven this week when Apple (AAPL) posts its Q3 results.
Elsewhere, interest rates bounced around, but 5% has so far proven to be resistance for the 10-year Treasury note. Some bond-buying in the back half of the week helped yield-sensitive areas – Real Estate outperformed the broader market.
The TIPS ETF, up five of the last six sessions, finished in the black, building off its early-October low. Making headlines in the commodity space is gold. The precious metal nearly closed at a fresh all-time weekly high close, and with a solid start to this week, October 2023 will be its best monthly settle. Oil, however, fell last week despite the ongoing conflict along the Gaza Strip.

October 20, 2023 - October 27, 2023
The Look Ahead
It’s another big week of economic data. Monday is quiet, so the focus will be on corporate earnings and intermarket price action. Halloween Tuesday features Q3 Employment Cost data and an August read on the S&P Case-Shiller Home Price Index. Don’t expect too much volatility around those reports, but the Conference Board’s October Consumer Confidence reading will offer a glimpse into business conditions and overall spending plans as the holiday shopping stretch amps up. Expectations about inflation will be in focus following last Friday’s hot University of Michigan 1-year inflation outlook among respondents.
Key data continues on Wednesday with ADP Employment kicking off a view of conditions in the labor market. ISM Manufacturing, always on the first business day of the month, will include key Employment and Prices Paid components at 10 a.m. ET. That’s also when JOLTS for September hits the tape, something the Fed closely monitors. A hot ISM and strong jobs data on Wednesday could upset the Treasury market.
Keep your seatbelts fastened through the afternoon as the Fed’s two-day policy meeting is widely expected to result in no change in the Fed Funds rate, but any hawkish comments from Chair Powell would likely stir up further volatility in bonds. Thursday is somewhat quiet, but the October Nonfarm Payrolls report posts Friday before the bell – economists expect 145k jobs created, which would be down from September’s toasty +336k.
This Week's Data Deck: Case Schiller, Consumer Confidence, ADP, ISM, JOLTS, FOMC, NFP
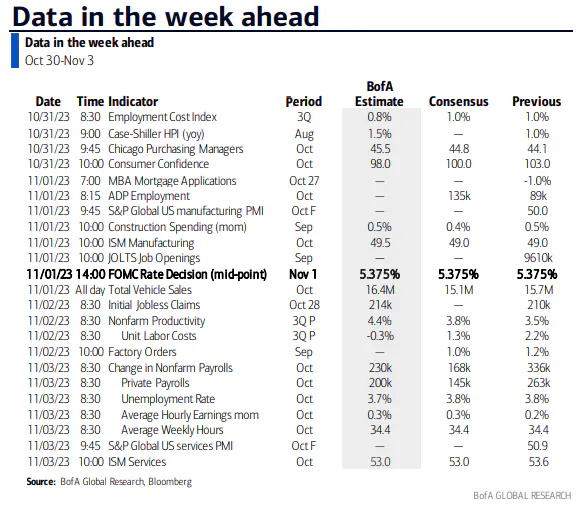
Source: BofA Global Research
Earnings Reports This Week
We’ll get a broad mix of industry updates via Q3 profit reports in the coming days. SoFi (SOFI) and McDonald’s (MCD) offer different consumer perspectives while on Tuesday Pfizer (PFE) and Amgen (AMGN) hope to revive the Health Care sector after a Pharma (ex-Eli Lilly (LLY) and Novo Nordisk (NVO)) drubbing in recent months. Caterpillar's (CAT) commentary will be interesting from a global economic demand perspective Tuesday morning and after the bell will be key for the chip space with results from AMD (AMD).
PayPal (PYPL) and Qualcomm (QCOM) are the highlights Wednesday and the weight-loss drugmakers will be in the spotlight Thursday in the pre-market – LLY and NVO both report before AAPL’s crucial Q3 results in the afternoon. Starbucks (SBUX) should offer color on the China macro pulse Thursday AMC, too. Also keep your ears tuned to the Energy sector with a handful of mid- and large-sized oil & gas companies reporting this week given recent M&A activity in the oil patch.
Entering the Backstretch of Q3 Earnings Season
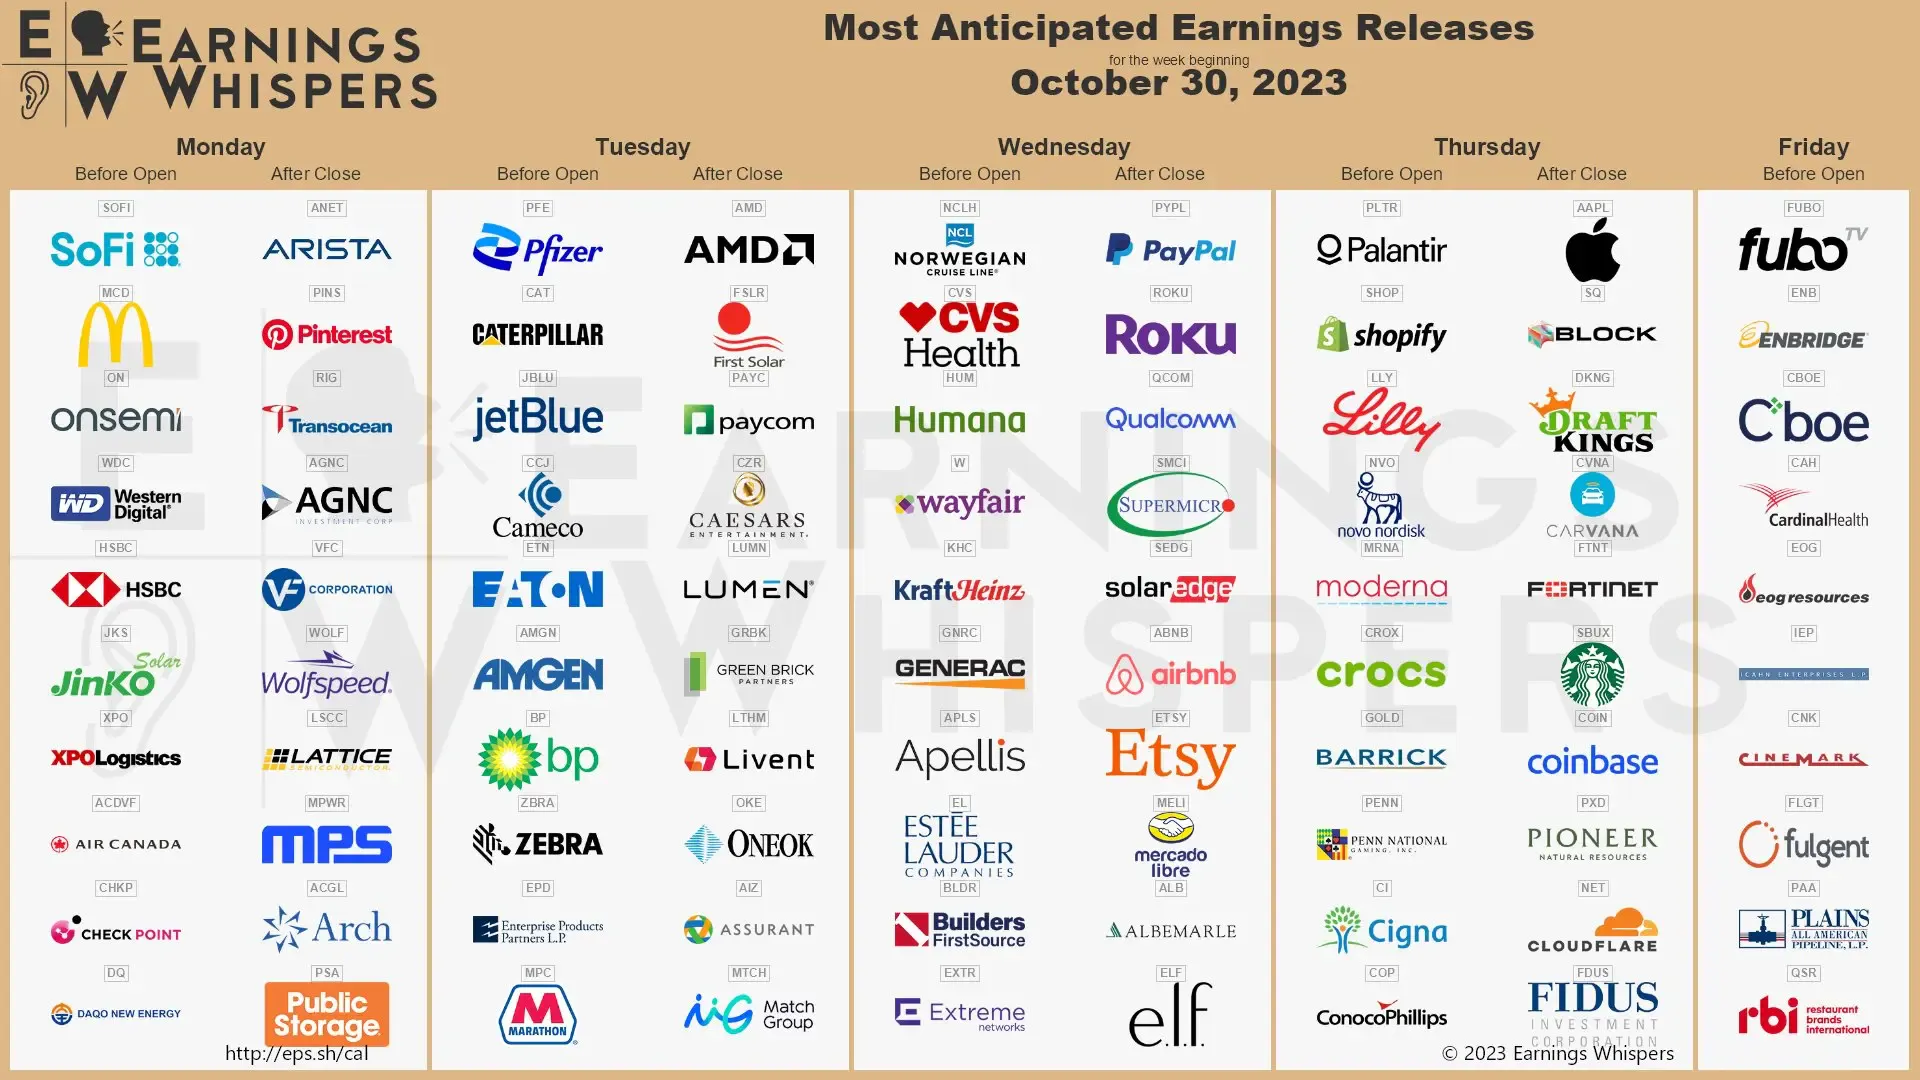
Source: Earnings Whispers
Topic of the Week: A Strong Consumer – Is That a Trick or a Treat?
The paradox of 2023 is without question how resilient the American consumer has been. Excess savings built up during the pandemic had been dwindling coming into this year, but a robust labor market and positive real wages led to a downright spending surge over recent months. All the while, various soft data, such as confidence surveys and even ISM & PMI readings suggested a more tepid pace of consumption would come about. That didn’t pan out.
Just take a look at the trend in GDP estimates for Q3. In July, economists were expecting sluggish, below-trend growth in the neighborhood of just +1.5%. A boomer of a June Retail Sales report triggered upside revisions that would persist through early Q4. It all sounds immaculate and bullish for the broader economy until you put the irresistible force that is the American consumer against the immovable object that is the Federal Reserve. Hot consumption has resulted in a Fed that must keep its foot on the economic brake pedal through tighter monetary policy.
Also since mid-July, interest rates have been on the increase and the US dollar has rallied in one of the most consistent rates of trend that I have ever seen. Since July 14, the long-dated Treasuries, as measured by the TLT ETF, are down more than 16% (dividends included). The dollar ETF (UUP) is higher by 8%. Stocks just could not compete with that kind of tightening in financial conditions. The S&P 500 is lower by 8% while debt-heavy small caps have been burned -16%. Other yield-sensitive areas like REITs and Utilities are down 17% and 12%, respectively.
Is strength in the consumer the lone culprit for this current market correction? Of course not, but it plays a leading role in the drama that has unfolded since the summer. This hawkish macro trend was underscored last week when a hot set of Personal Income and Outlays data was released. Total outlays of +0.9% in September were driven by a 0.7% MoM jump in spending while disposable income grew by just 0.3%. The result was a Personal Saving Rate that dipped to 3.4% - the lowest of the year. It could mean one of two things: (1) Consumers are stretched too thin, increasing their reliance on credit cards and other forms of debt to pay for everyday items, or (2) consumers are strong, with high confidence in their jobs and incomes heading into the holiday shopping season.
No matter the reason, Chair Powell and the FOMC would prefer to see households scale back on their spending. It might take a significant hit to the employment picture for that to happen. We’ll get key reads on that situation this week with the usual set of early-month labor condition indicators. I will be keeping my eye on not only the headline job change figures, but also internal indicators like JOLTS quits rate, small business hiring within the ADP report, and average hourly earnings & total hours worked data in Friday’s NFP dataset.
Consumers Spooked by Geopolitical Conflicts?
Another gauge the Fed keeps tabs on is how workers view inflation looking ahead. The University of Michigan’s Consumer Survey not only includes a sentiment barometer, but its inflation expectations data often moves the bond market. Last Friday, it was reported that 1-year inflation expectations unexpectedly jumped to 4.2%. That was revised higher from 3.8% in the prior look.
Now, this is often a whippy number - usually driven by near-term fluctuations in retail gas prices. This go-around, though, it’s not clear what was the catalyst to send inflation expectations to their highest mark since Q2. One thought is that the Israel-Hamas war may have rattled Americans’ psyche, causing fears of imminently higher oil prices. Of course, that has not played out, so this could be a one-time blip. Still, it bears watching as we head into 2024.
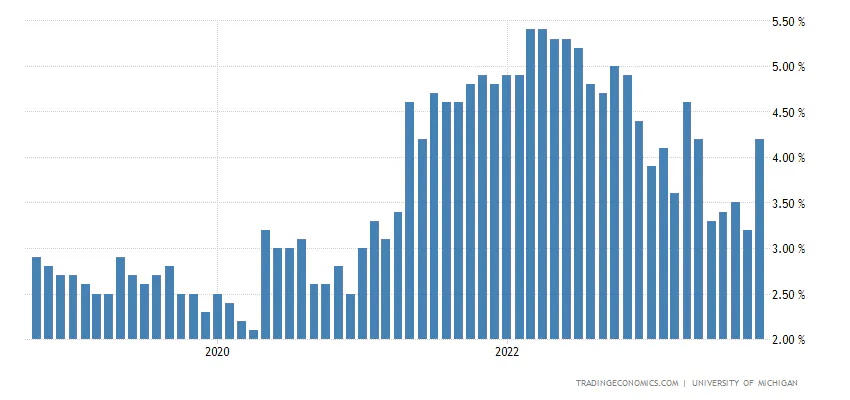
Source: Trading Economics
The US Economy’s Sugar High
Robust spending was also seen in last week’s Q3 GDP report. This was a widely anticipated dataset given how strong the Atlanta Fed’s GDPnow tracker was as the third quarter progressed. Consumption, being nearly 70% of annual domestic GDP, verified strong at +2.7% while Private Domestic Investment also boosted total demand.
In all, the economy expanded on an inflation-adjusted basis by 4.9% in Q3, above economists’ expectations for just +4.3%, and far stronger than Q2’s 2.1% advance. Some pundits claim that consumers were forced to dole out more for housing and utilities, health care, and food, but in general, it was viewed as a healthy report. Clearly, higher interest rates and tighter Fed policy are yet to have a significant impact on economic growth.
A Q3 Consumption Surge Sends US Real GDP Growth Soaring
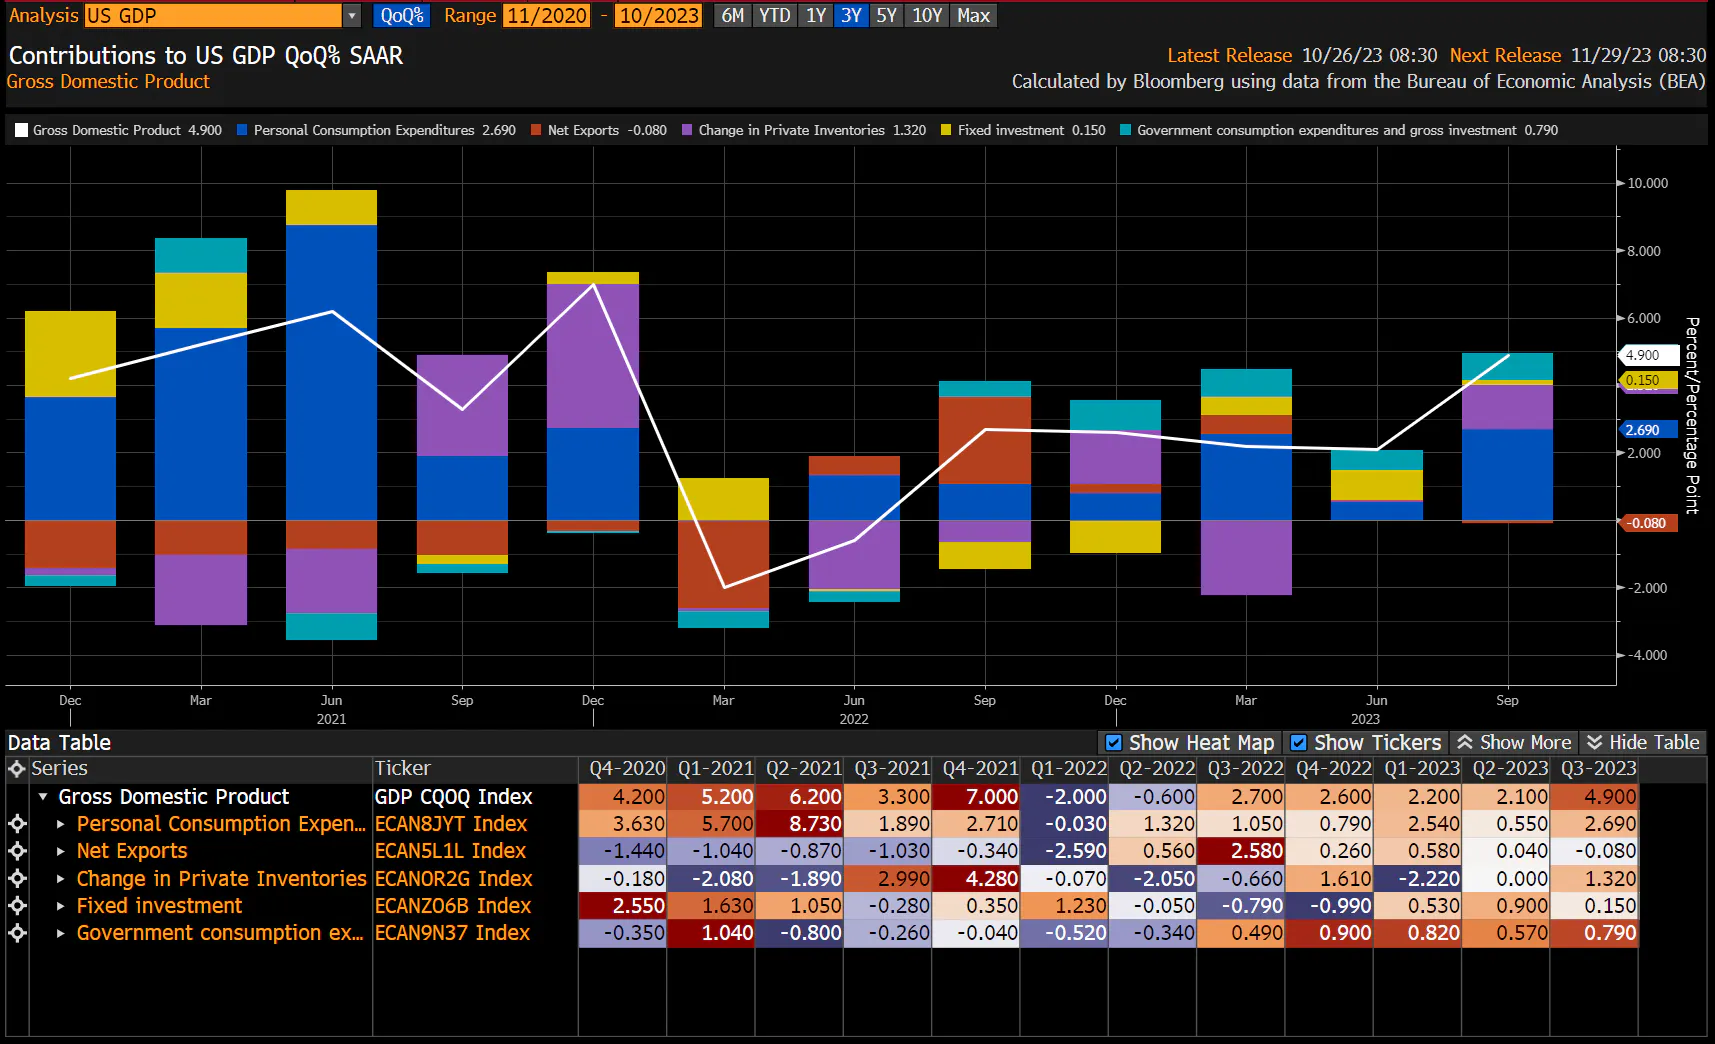
Source: Michael McDonough, Bloomberg
Will Growth Persist into Q4?
Not surprisingly, we are already seeing upward revisions to fourth-quarter growth forecasts. Goldman Sachs launched its Q4 GDP tracker at +1.6%, rubbing out the chance of another government shutdown from its slate of downside risks. Another macro problem is coming off the table – last week the United Auto Workers reached a deal with Ford to end its strike, and news broke over the weekend that the labor union agreed to a tentative agreement with Stellantis.
All that’s left is for General Motors and the UAW to make peace. Should that happen, then thousands of workers would abandon the picket lines and rejoin the assembly lines. One of Goldman’s so-called Q4 “potholes” won’t go away with the stroke of a pen, though: Student loan repayments are in full swing, and it's unknown if that extra cash outlay will dampen holiday spending.
Risk-Off Trading Activity
Turning to price action and how it all impacts you and your money, we cannot ignore what’s happening with gold amid so much geopolitical unrest and ever-rising Treasury yields. A troy ounce will now set you back about $2k, up sharply from lows under $1850 just a few weeks ago. Often, rising real interest rates and a stronger greenback are death knells for near-term gold bugs, but intermarket relationships are never set in stone.
Perhaps the conflict in the Middle East was the catalyst to send gold higher, but technicians are focused on a long-term breakout that could be emerging. A rally above $2100, particularly over the course of several weeks or months, may portend a longer-term bull run, much like what was seen in the 2000s – at least that is what the chartists might say. It’s something to monitor – along with the ongoing price strength in bitcoin.
Elsewhere, market-watchers remain fixated on the 2-year/10-year Treasury rate spread as it draws closer to un-inverting. The “bear steepener” trade has been awful for yield-sensitive areas – US small caps printed fresh bear-market lows last week.
What’s Gold Telling US? The Yellow Metal Tops $2000 Intraday.
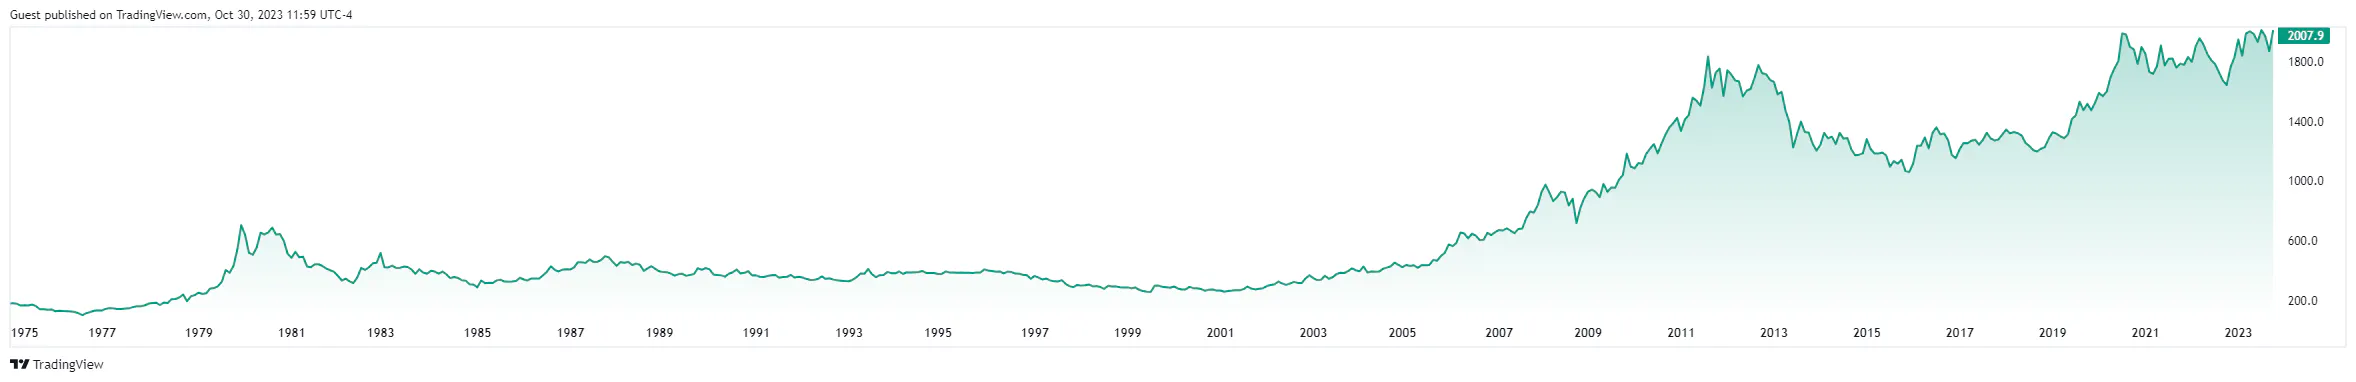
Source: TradingView
Where Higher Rates Hurt the Most: Small Caps Plunge to 3-Year Lows
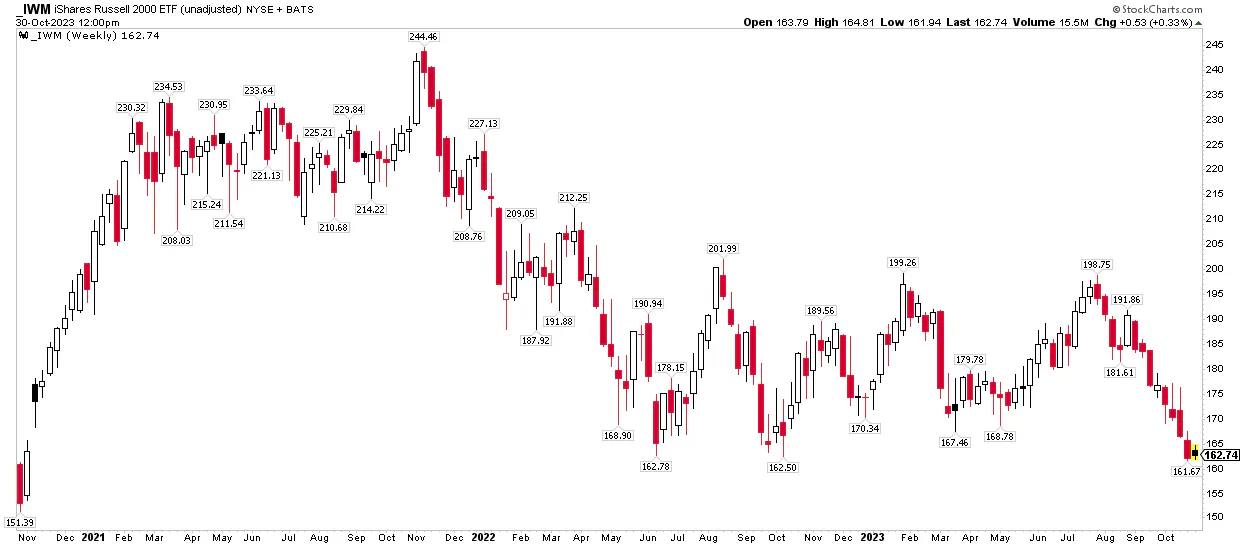
Source: Stockcharts.com
How About Some Seasonal Cheer?
Finally, Goldman put out a technical note last week reminding investors not to be too bearish after three months of recent selling. Seasonally, the S&P 500 tends to rally from late October through early January. I like to say that seasonality is a secondary indicator to price action, but this is a bullish data point. If we see weakness in the next two months, that could have particularly pessimistic implications for 2024 economic prospects and corporate earnings.
The Bottom Line
Most data last week highlighted how much the consumer continues to spend. It’s unclear, however, if the consumer is truly ‘strong.’ Either way, higher household demand keeps the Fed in a tight spot. No policy rate increase will happen this week, but the ‘higher for longer’ mantra is truer than ever – and that has been a ghoulish trend for the bulls since late July.
Want access to your own expert-managed investment portfolio? Download Allio in the app store today!
Related Articles


The articles and customer support materials available on this property by Allio are educational only and not investment or tax advice.
If not otherwise specified above, this page contains original content by Allio Advisors LLC. This content is for general informational purposes only.
The information provided should be used at your own risk.
The original content provided here by Allio should not be construed as personal financial planning, tax, or financial advice. Whether an article, FAQ, customer support collateral, or interactive calculator, all original content by Allio is only for general informational purposes.
While we do our utmost to present fair, accurate reporting and analysis, Allio offers no warranties about the accuracy or completeness of the information contained in the published articles. Please pay attention to the original publication date and last updated date of each article. Allio offers no guarantee that it will update its articles after the date they were posted with subsequent developments of any kind, including, but not limited to, any subsequent changes in the relevant laws and regulations.
Any links provided to other websites are offered as a matter of convenience and are not intended to imply that Allio or its writers endorse, sponsor, promote, and/or are affiliated with the owners of or participants in those sites, or endorses any information contained on those sites, unless expressly stated otherwise.
Allio may publish content that has been created by affiliated or unaffiliated contributors, who may include employees, other financial advisors, third-party authors who are paid a fee by Allio, or other parties. Unless otherwise noted, the content of such posts does not necessarily represent the actual views or opinions of Allio or any of its officers, directors, or employees. The opinions expressed by guest writers and/or article sources/interviewees are strictly their own and do not necessarily represent those of Allio.
For content involving investments or securities, you should know that investing in securities involves risks, and there is always the potential of losing money when you invest in securities. Before investing, consider your investment objectives and Allio's charges and expenses. Past performance does not guarantee future results, and the likelihood of investment outcomes are hypothetical in nature. This page is not an offer, solicitation of an offer, or advice to buy or sell securities in jurisdictions where Allio Advisors is not registered.
For content related to taxes, you should know that you should not rely on the information as tax advice. Articles or FAQs do not constitute a tax opinion and are not intended or written to be used, nor can they be used, by any taxpayer for the purpose of avoiding penalties that may be imposed on the taxpayer.