Updated May 18, 2023

Raymond Micaletti, Ph.D.
Macro Money Monitor
Market Recap
Stocks were not far from the flatline last week as earnings season wraps up and key inflation data hit the tape. The S&P 500 fell 0.3% while the NASDAQ Composite once again outperformed most other areas with a 0.4% advance. The GSCI Commodity Index gave back 1.2%, hampered by a strong dollar; gold dropped 0.25%. The Real Estate sector underperformed the broader market with a 0.9% decline.
It was another ‘ho-hum’ trading week in terms of price action. The S&P 500 has ranged just 4% since early April. Widen the scope, and equities are little changed from a year ago and on the 2-year stack. This is what bear markets often look like, and they sometimes have the feeling of frustration for both the bulls and the bears at various times.
Stuck in a Rut: S&P 500 Ranges Just 3.3% Since the Start of Q2

Source: Stockcharts.com
How's 2023 Faring?
For the year, the SPX is up 7.4%, and the gains have been focused in just a handful of mega cap names found in the NASDAQ. As of earlier this month, the 20 biggest stocks had accounted for about one-third of the overall market’s 2023 rally. And that’s seen perhaps most clearly in the sector performance comparison in 2023.
The Communications Services group is higher by 25% followed by Information Technology’s 21.6% climb. Rounding out the growth trio is Consumer Discretionary, which has returned about 15% through last Friday. The remaining eight sectors have underperformed the S&P 500 with the worst being, not surprisingly, Financials (-6%) and Energy (-9%). After the value style’s massive alpha against growth last year, that trend has reversed in 2023.
The Growth Versus Value Trade
What’s the culprit for such relative favor of growth equities versus value? Chalk it up to interest rates dropping and looming fears of a recession. You see, when macro growth concerns rise, investors often seek to own companies that can weather any environment with their own growth story. Firms with rising profits in the face of a deteriorating economy become a scarce commodity in a sense.
We saw that during much of the 2010s when both domestic and global GDP growth rates were sluggish – mega-cap tech (the FAANG companies) produced monster alpha. The twist in this year’s performance gap in favor of the biggest of big stocks is that investors were also positioned offsides at the end of 2022 – light on tech and overweight value.
The thought was that banks, oil companies, and industrials would continue to sport relative strength in 2023. The regional banking crisis of March, lower energy prices in recent months, and a turn south in manufacturing activity have all put pressure on the so-called “value trade.”
And last week we took in more “growth scare” data points, but there was nuance to it which adds a layer of uncertainty for the second half of Q2. The big news was Wednesday’s CPI data that verified near expectations. The headline jump in consumer prices was a touch lower than economists forecasted, rising 4.9% on a year-over-year basis. It was the 10th consecutive fall in CPI dating back to June of last year.
On a sequential basis, CPI was higher by 0.4% from March to April at both the headline and core levels. The S&P 500 was not much changed after that key report. Investors have come to grips with the reality that short-term inflation is clearly on the mend. (The next two CPI reports should show even better year-on-year readings considering that so many commodity prices reached their peaks in June 2022.) Jitters are now caused by poor data hitting the tape. The fear is that the Fed might be doing too much to quell the rise in consumer prices.
Ten Consecutive Months of Improving Headline CPI
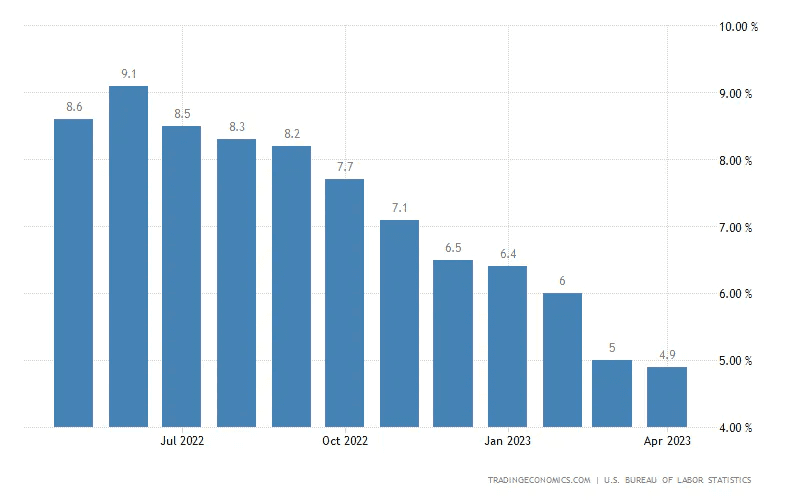
Source: TradingEconomics
In fact, the market has priced in a chance that Fed Chief Powell might not be done hiking rates. There is about a 15% probability, according to the rate futures market, that another quarter-point rise is in the cards at the June 14 FOMC meeting. The April payrolls report was yet another in a series of hotter-than-expected employment readings. But another macro pulse released last Friday suggests Main Street is still worried about inflation.
The April gauge of Consumer Sentiment issued by the University of Michigan revealed that not only are folks downbeat about the state of the economy, but they also believe inflation will be elevated in the next 12 months and when looking out 5-10 years. Traders focused on the inflation expectations data on Friday, and yields crept higher during the day. We also noticed rising odds of another quarter-point policy rate increase.
Dismal UMich Consumer Sentiment and Troubling Inflation Expectations
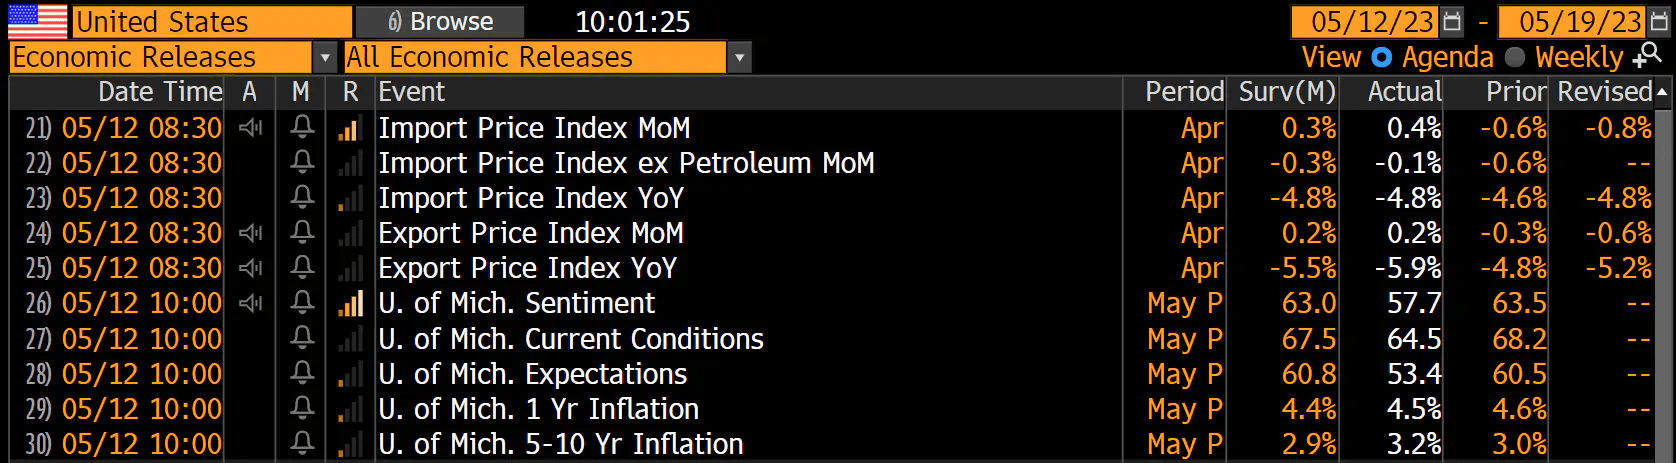
Source: Joe Weisenthal, Bloomberg
More spooky macro data crossed the wires Thursday morning. Weekly jobless claims data showed an unexpected jump in workers’ unemployment applications. Markets initially reacted negatively to that news which seemed to suggest that a recession may hit sooner than previously thought, but the reason for the spike was an unusual surge in Massachusetts’ jobless claims due to fraudulent filings. Back out that anomalous reading, and the data is smoother.
Massachusetts’ Jobless Claims Spike Distorts the Nationwide Figure
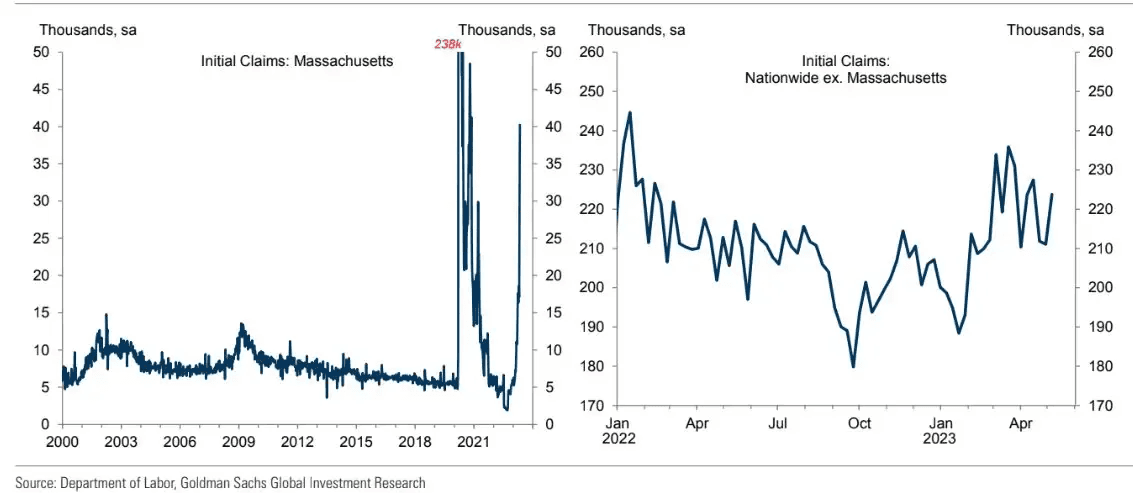
Source: Goldman Sachs
As consumer sentiment sours, retailers gear up to report their Q1 results this week. Names like Walmart, Home Depot, Alibaba, TJX Companies, Target, Ross Stores, and Foot Locker all issue earnings reports. Recall it was a year ago when Walmart and Target stunned the street with downright awful inventory management execution amid the supply chain crisis that hallmarked early 2022.
Don’t expect nearly as much volatility this time around. Not only is the first quarter a light period of the year for retail, but logistical roadblocks coming out of the pandemic are essentially cleared up. Still, with individuals and families continuing to draw on excess savings and tapping record amounts of credit, the question is, “How long can the consumer keep propping up the economy?”
Final Week of Earnings: Retailers Hit the Checkout Line

Source: Wall Street Horizon
There are growing signs that the American consumer is getting stretched closer to the breaking point. One indicator we like to monitor is outstanding consumer credit. Back on May 5th, the March data was released by the Federal Reserve. It showed a 5.4% jump in Q1 with a stunning 12.3% surge in revolving credit. In March alone, total consumer credit rose 6.6% with a preliminary 17.3% spike in the revolving credit category.
As analysts and portfolio managers, we are often like detectives – putting together various clues to form the market’s mosaic. In this case, more people are tapping credit cards all while total card spending per household is cooling off quickly, according to Bank of America’s April Consumer Checkpoint report.
This is a double whammy in that there’s less spending going on with increasing reliance on borrowing. The kicker here is that the average interest rate on credit cards has climbed above 20%, up more than four percentage points from a year ago, according to the Federal Reserve.
Americans Racking Up Credit Card Debt at More Costly Borrowing Rates
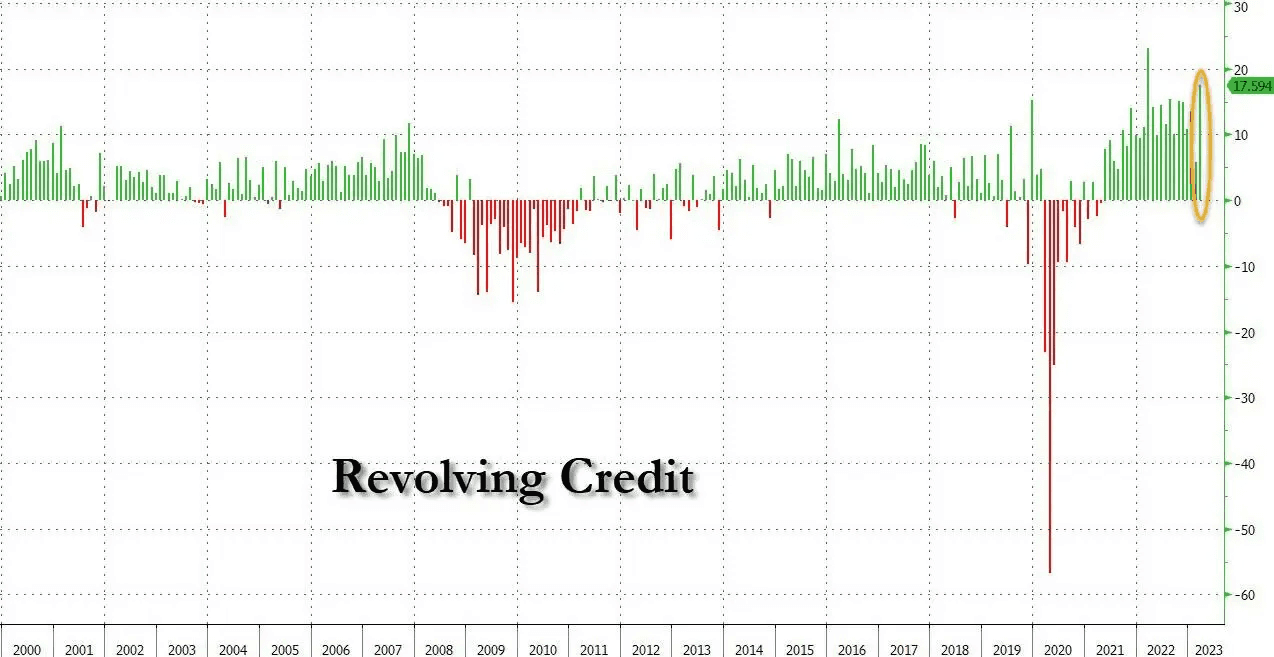
Source: Zerohedge, Federal Reserve
Total Spending Is Now Lower Y/Y As of April, per BofA Card Spending Data
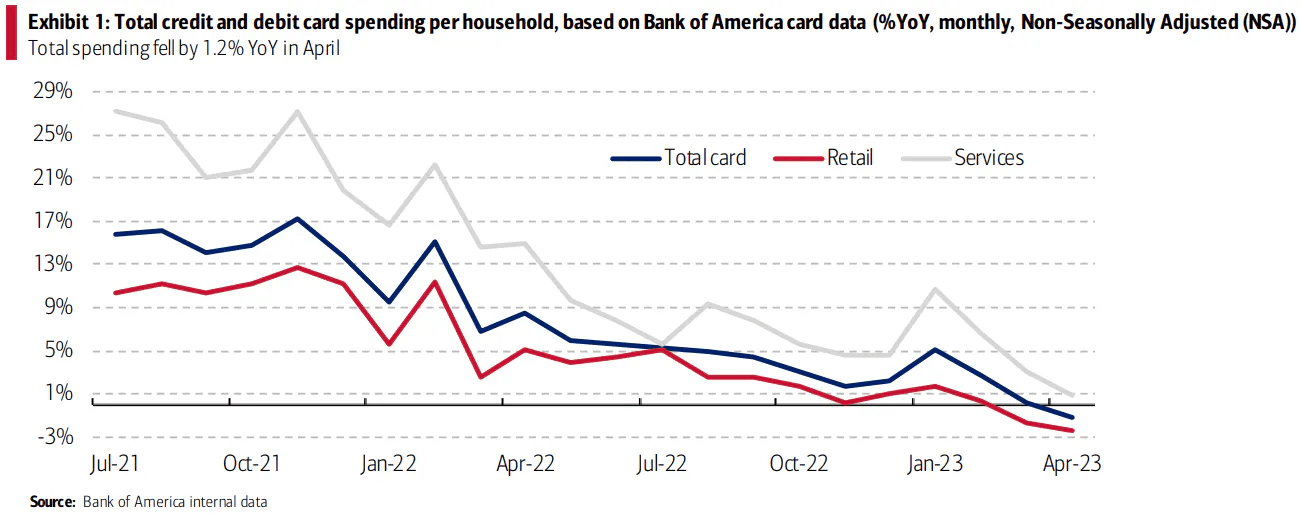
Source: BofA Global Research
So, maybe this week’s slew of Q1 retail earnings reports will indeed be market-moving. And it might not be the bottom-line numbers that are the focus of Wall Street, but the outlooks provided by CEOs on earnings calls. Unless the world’s biggest retailers see signs that we don’t, the breadcrumbs clearly point to a worsening consumer landscape.
Of course, that is just what the Fed wants right now. Lower spending, softer manufacturing and services activity, and even outright job losses for a period would help to get inflation back to the FOMC’s target range. As of now, the market sees that happening. Just take a look at 2-year inflation breakevens (which compare the yield on the 2-year Treasury note to that of 2-year TIPS). It notched from lows dating back to late 2020 last week, under 2%. Also, the swaps market, another useful gauge of anticipated CPI rates, prices in 2-year inflation at just 2.16% as of last Friday.
Treasury Yields Suggest Softer Inflation Rates Over the Next Two Years
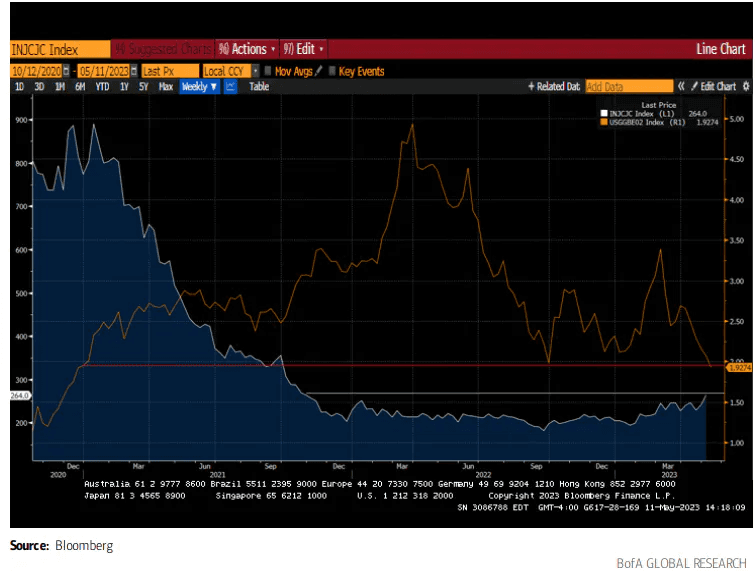
Source: BofA Global Research, Bloomberg
Turning away from the consumer, while the equity market has been calm lately, there were big moves in the U.S. Dollar Index last week. Thursday and Friday featured steep rises in the greenback despite the soft economic data. The Index settled last week at the highest level since late March. We’ll have to monitor currency movements to see if this is the start of a lasting trend, but technical support in the 100 to 101 range on the “DXY” held successfully during its recent decline.
In general, a strong dollar pressures stocks and many domestic companies’ earnings per share, with even steeper negative impacts on foreign equities. For now, this is just a warning sign, not an imminent danger alert.
U.S. Dollar Index Rises to Cap Off the Week
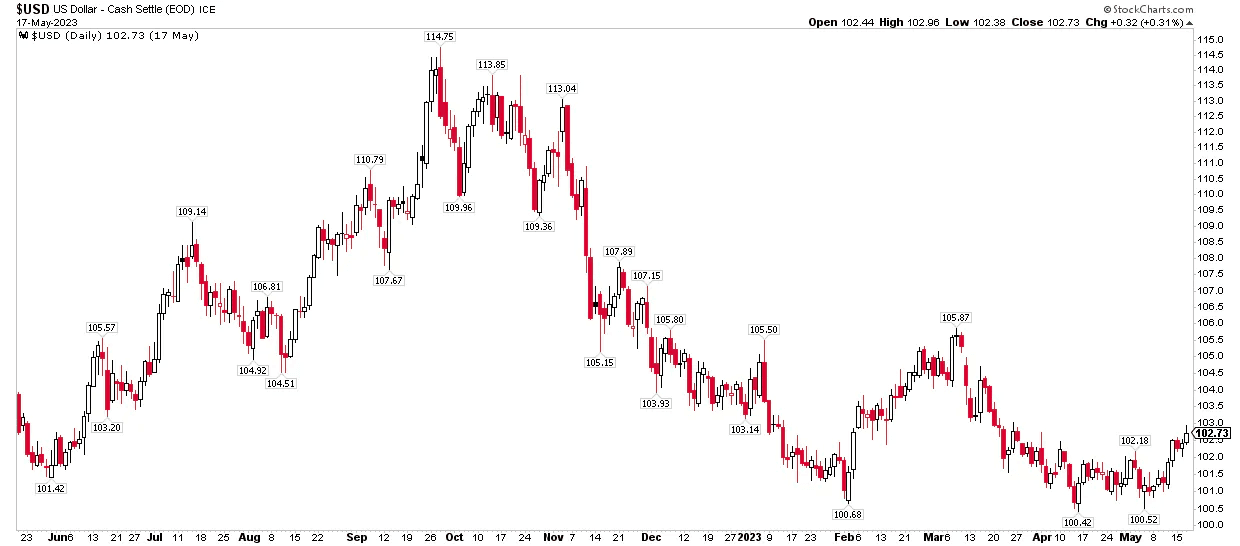
Source: Stockcharts.com
One more risk for markets that is just now starting to enter the mainstream is the likelihood that the Biden Administration (and Democratic members of Congress) will put added pressure on Powell and the Fed to ease off the economic brake pedal. You see, a slowing economy is not ideal for elected officials who are on the ballot in less than 18 months.
As it stands, the consensus calls for a technical recession in the back half of the year. The overall probability of recession is priced at 65% using a diffusion index of many indicators. That would be quite an inopportune time for employment losses and a rising unemployment rate to command the nightly news headlines. Our policy overlords will likely seek to juice the markets and economy in any way they can to help secure their jobs. This is part of the reason stocks often do well in pre-election years.
Goldman’s Is Sanguine on Recession Risks, But the Consensus Isn’t
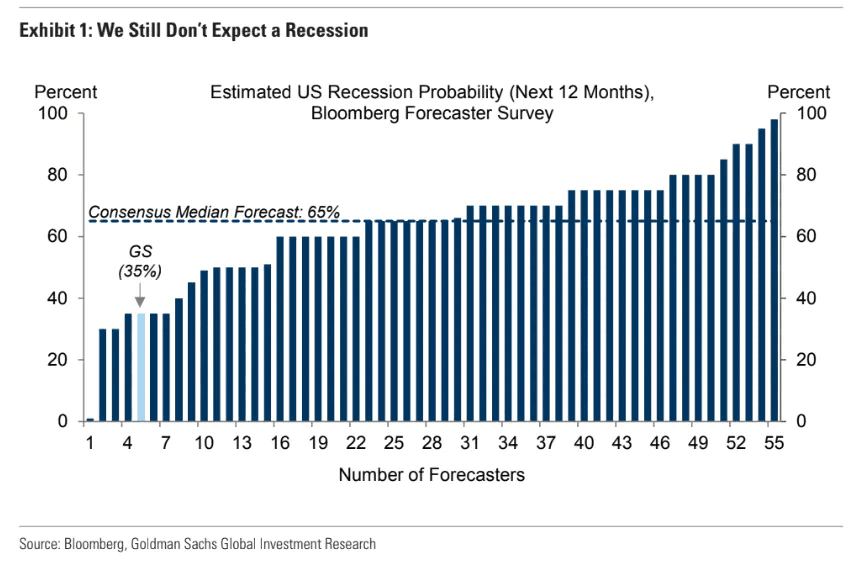
Source: Goldman Sachs
Putting all that together, the VIX closed last week near 17 – below the historical average of about 20. With so much uncertainty, including ongoing banking risks, a worsening of the consumer environment, a debt debacle, and growing political instability, you would think volatility would be jumpy. That’s not so.
Part of the reason is how the market is constructed – the mega caps command such a high weight while cyclicals’ downturn is offset by high-duration growth stocks’ rise. So, there is a balancing mechanism at play right now, but the VIX futures curve suggests that volatility might not be so far down the line.
Volatility Is Absent Today, But May Be Present in Q3
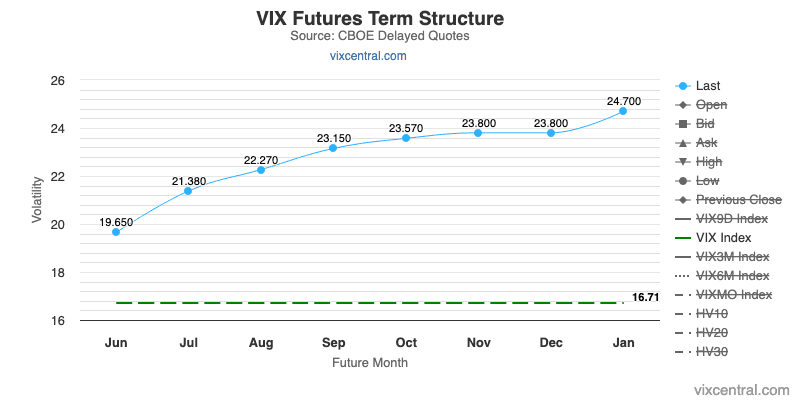
Source: VIX Central
The Bottom Line
Stocks feel like they are just waiting for the next big macro catalyst. A range-trade persists while Treasury yields are generally on the decline (sans the 1-month T-bill which continues to print 20-year highs ahead of the debt ceiling X-date). All eyes are on the consumer this week with key earnings reports on tap and April Retail Sales data being released on Tuesday morning. Going forward, expect more political pressure on the Fed as the Presidential election cycle draws closer.
Want access to your own expert-managed investment portfolio? Download Allio in the app store today!
Related Articles


The articles and customer support materials available on this property by Allio are educational only and not investment or tax advice.
If not otherwise specified above, this page contains original content by Allio Advisors LLC. This content is for general informational purposes only.
The information provided should be used at your own risk.
The original content provided here by Allio should not be construed as personal financial planning, tax, or financial advice. Whether an article, FAQ, customer support collateral, or interactive calculator, all original content by Allio is only for general informational purposes.
While we do our utmost to present fair, accurate reporting and analysis, Allio offers no warranties about the accuracy or completeness of the information contained in the published articles. Please pay attention to the original publication date and last updated date of each article. Allio offers no guarantee that it will update its articles after the date they were posted with subsequent developments of any kind, including, but not limited to, any subsequent changes in the relevant laws and regulations.
Any links provided to other websites are offered as a matter of convenience and are not intended to imply that Allio or its writers endorse, sponsor, promote, and/or are affiliated with the owners of or participants in those sites, or endorses any information contained on those sites, unless expressly stated otherwise.
Allio may publish content that has been created by affiliated or unaffiliated contributors, who may include employees, other financial advisors, third-party authors who are paid a fee by Allio, or other parties. Unless otherwise noted, the content of such posts does not necessarily represent the actual views or opinions of Allio or any of its officers, directors, or employees. The opinions expressed by guest writers and/or article sources/interviewees are strictly their own and do not necessarily represent those of Allio.
For content involving investments or securities, you should know that investing in securities involves risks, and there is always the potential of losing money when you invest in securities. Before investing, consider your investment objectives and Allio's charges and expenses. Past performance does not guarantee future results, and the likelihood of investment outcomes are hypothetical in nature. This page is not an offer, solicitation of an offer, or advice to buy or sell securities in jurisdictions where Allio Advisors is not registered.
For content related to taxes, you should know that you should not rely on the information as tax advice. Articles or FAQs do not constitute a tax opinion and are not intended or written to be used, nor can they be used, by any taxpayer for the purpose of avoiding penalties that may be imposed on the taxpayer.