Updated October 10, 2023

Mike Zaccardi, CFA, CMT
Macro Money Monitor
Market Recap
Stocks endured a volatile week, but the S&P 500 managed to finish in the black by 0.5% following a positive reaction to Friday’s jobs report. Information Technology and Communication Services were the best sector performers, helping the Nasdaq to a 1.6% advance.
Commodities finally turned south after a solid third-quarter rally – oil’s big retreat sent the Goldman Sachs Commodities Index spiraling to a 5.3% loss, its worst weekly performance since March.
Gold, too, lost ground amid a further rise in real yields, finishing Friday at $1845. The yellow metal was down nine sessions in a row before a relief rally on Friday. The TIPS ETF remains mired in a bear market, and the fund settled the week in the red by 1.3% for its lowest close of the year.
Real Estate stocks, however, registered their first 3-day winning streak since late August despite the bond market selloff, though XLRE was still lower for the week.
Year-to-date, the S&P 500 is up 12% while the Nasdaq is higher by 28%.

September 29, 2023 - October 6, 2023
The Look Ahead
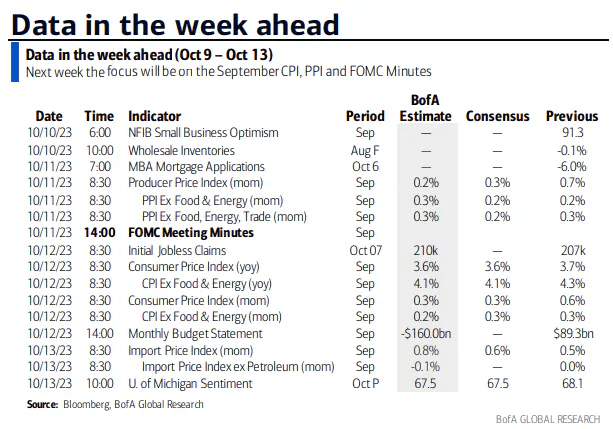
It’s another big week of economic data as the Q3 earnings season gets rolling. Monday is Columbus Day, a holiday for the bond market, though the NYSE is open. Tuesday is light – the September NFIB Small Business Optimism Index comes out in the pre-market before August Wholesale Inventories at 10 a.m. ET.
The real action gets going on Wednesday when the Producer Price Index (PPI) report for September hits the tape at 8:30 a.m. Traders are looking for a rise of 0.2% on the headline and up three-tenths on the core. Later in the day, the minutes from the September FOMC meeting are released.
The Fed decision three weeks ago didn’t feature a policy rate move, but it turned out to be a market-moving announcement considering that the dot plot revealed two projected rate cuts erased from the committee’s 2024 outlook. Treasury selling, particularly at the long end of the curve, has been fierce since then.
Expect another low Jobless Claims number Thursday morning amid a labor market that, according to the September non-farm payrolls report, remains cookin'. Last week’s 207k claims figure asserts that relatively few workers are applying for unemployment benefits. Also at 8:30 a.m. Thursday is the Consumer Price Index (CPI) report for September.
Expectations are for a 3.6% year-over-year CPI rise on the headline and a 4.1% climb on the core – those figures would be a slight moderation from August’s readings.
A cool set of PPI and CPI numbers could take a November rate hike off the table given some recent “Fed speak” suggesting that higher market rates are doing the Fed’s job for them. Hot inflation prints, though, would likely be met with stock and bond market volatility during this fragile period on the calendar.
The data-heavy week wraps up with import prices before the bell on Friday (another inflation proxy) and a preliminary read on the consumer with the University of Michigan Consumer Sentiment Survey.
More Major Macro Events & Reports on Tap
Source: BofA Global Research
Fed members will be out and about, potentially stirring up volatility across markets. Monday through Wednesday are particularly heavy on Fed Speak before the FOMC minutes cross the wires. Thursday and Friday feature comments from the Fed’s Bostic and Harker, respectively.
Finally, Q3 earnings begin rolling in. PepsiCo (PEP) is sometimes glossed over, but after severe underperformance among debt-heavy defensive companies and as weight-loss drugs impact food and beverage firms, PEP’s earnings outlook could be particularly revealing. Thursday morning then features some of the usual early-season reporters – BlackRock (BLK), Delta (DAL), and Walgreens (WBA).
The unofficial kickoff comes when JPMorgan Chase (JPM) serves up Q3 numbers along with the Dow’s biggest component, UnitedHealth Group (UNH) early Friday. Citi (C) and Wells Fargo (WFC) issue numbers on the big-bank side while PNC (PNC) reports from the regional perspective within the Financials sector.
Q3 Earnings Season Takes Flight This Week

Source: Wall Street Horizon
Topic of the Week: The “Back to Work” Season?
The labor market continues to defy expectations. While the Bureau of Labor Statistics had been revising downward monthly job-gain numbers throughout 2023 coming into last Friday’s September payrolls report, the headline figure of +336k positions created came alongside significantly higher changes to the previous two months. August’s gain of +227k was 40k above the initial print while July’s revised figure is now +237k, up from just +157k. In all, it was the 33rd straight month of job increases.
Upon Closer Inspection...
So, this was a super-inflationary gauge of the labor market, right? Not so fast. As always, you can be your own analyst by peeling back the layers. Take a look at the average hourly earnings figures for September. You’ll see that the +0.2% monthly rise was softer than what economists were expecting. The year-over-year change of +4.2% was down 0.1ppt from August, also less than the consensus forecast. These are the real inflation gauges when it comes to today’s labor market.
The 3.8% unemployment rate was unchanged from a month earlier, and the same goes for the labor force participation rate at 62.8%. As more positions low-wage positions get filled, it could even help to alleviate any lingering labor shortages across the services side of the economy.
Econ 101: Establishment Survey Versus Household Survey
Keep your analyst hat on a bit longer. It’s key to remember that there are two datasets included in the broad Employment Report, released (usually) on the first Friday of the month: (1) the establishment (company) survey, and (2) the household survey. The former is used to determine the headline nonfarm payrolls figure and employee earnings amounts while the latter interviews households, and the unemployment rate is calculated using those data. The household survey also provides alternative measures of employment, such as the U-6 “underemployment rate” and the labor force participation percentage.
Household Survey Says: Soft Signs of Hiring
For September, the household survey showed little change in the number of unemployed persons (6.4 million nationwide), leading to no changes in the unemployment rate, underemployment rate, and participation rate. Overall, the household survey, at +86k, was somewhat weak and aligned with last Wednesday’s ADP Employment report, +89k, in terms of monthly job gains. Those figures should be taken with a hefty grain of salt since both reports are considered volatile from month to month.

Source: Council of Economic Advisors
Rates Spiked and Stocks Dipped Post-NFP, But Both Reversed on Friday
Taking off your economist hat and donning your trader hat, the market’s reaction to all the employment numbers was fascinating last week. Let’s level-set by checking on where things were coming into last week. It might seem like ages ago, but fears of a government shutdown were front and center as the calendar flipped to the notoriously volatile month of October. A last-minute 45-day stopgap spending bill put forward by now-former House Speaker Kevin McCarthy sent stock market futures rising ahead of the trading week. Alas, those gains were fleeting. Sellers emerged Monday to send the S&P 500 to its lowest level since early June.
Making Sense of the Employment Situation
While the SPX settled fractionally higher by the close last Monday, Tuesday featured more persistent selling after a hot August JOLTS report, which indicated a material uptick in the number of job openings. Equities rebounded on Wednesday following a cool ADP Employment report and as Treasury yields eased from Tuesday’s near-term peak. The real action took place Friday as interest rates spiked to fresh cycle highs immediately after the NFP report was released. The algorithms first paid attention to the strong headline jobs gain, sending stock market futures sharply in the red. By late morning, however, yields came off their highs and stocks were in rally mode. The price action was similar to the market low in October last year following an unnervingly hot September 2022 CPI report.
Was Friday a ‘Tradeable Low’?
It was a very ‘Octobery’ week, and we do not think the ‘all clear’ has been given for the usual year-end rally to commence quite yet. Our view remains cautious, and we would like to see more evidence for a near-term bottom in stocks (and bond prices) to help set the stage for an upside reversal to what has been a run-of-the-mill correction since the highs notched in late July. Friday may have been a bit of a relief rally or even a covering of some shorts ahead of the weekend. Technically, all eyes are on the 4200 level of the SPX as well as the rising 200-day moving average as we approach the 1st anniversary of the 3492 low.
S&P 500 Nears the 1-Year Mark on What Has Been a Narrow Rally

Source: Stockcharts.com
Macro Price Action: Yields Keep Trending Higher...
We’ll be watching how Treasury yields move over the coming days and weeks. There remains a high correlation between the two asset classes as inflation remains a concern as well as questions as to who the buyers of long-dated Treasuries will be now that Japan and China have pared back their purchases. Additionally, in order to service the growing national debt and higher interest payments, a heavy amount of Treasury bill issuance is on the docket – further pressuring yields higher. Away from government bills, notes, and bonds, corporate credit conditions turned dicier last week. I spotted a potential bearish breakdown on the iShares High Yield Corporate Bond ETF (HYG) that ‘bears’ watching as Q4 unfolds.
...But Has Oil Put in Its High for 2023?
We haven’t even touched on the major downward reversal in the oil market so far this month. WTI was above $95 for a time in late September but ended last week under $83, its worst 10-day stretch since May of 2022. That is good news for consumers who will benefit from retail gasoline prices that should retreat from near $3.70 today to perhaps $3.20 by Halloween. It’s bad news, however, for Q3’s strongest sector – Energy.
The group was down 5% last week, and news of ExxonMobil (XOM) seeking to acquire Pioneer Natural Resources (PXD) for $60 billion caused added volatility in the oil & gas space on Friday. While M&A is often a bullish sign, this deal is questionable given the modest premium paid for PXD. At the same time, it may be indicative of just how much free cash flow the cheaply valued Energy sector is producing with WTI in the $80s.
Terror in the Middle East
Finally, geopolitical risks are back on the table which could impact the oil patch and other multinational industries. Israel says it is “at war” and vows “mighty vengeance” following surprise attacks by Hamas after hundreds have been reported dead along the Gaza Strip; fighting continues this week. Over the weekend, Hamas terrorists launched its largest attack on Israel in years, and global ramifications are sure to come. It is certainly a disturbing human tragedy, and financial markets may see added volatility as coordinated efforts from major militaries could be quickly on the way. Israel’s Tel Aviv-35 Index plunged 6% on Monday – its biggest drop since March 2020.
Tel Aviv-35 Index Drops Following Terrorist Attacks

Source: Bloomberg
The Bottom Line
The most volatile month of the year since 1950 is October. Risks are present this time – some new, some emerging. While equities bounced impressively on Friday after the big headline payrolls climb, decade-plus highs in yields and a 20-year low in the equity risk premium present challenges for the bulls as the Q3 corporate earnings season gets underway. The good news is that we are nearing a bullish seasonal stretch, but it might take a larger selling event to trigger a meaningful inflection. We will continue watching the rates market, what’s happening in oil, and if the dollar continues its ascent.
Want access to your own expert-managed investment portfolio? Download Allio in the app store today!
Related Articles


The articles and customer support materials available on this property by Allio are educational only and not investment or tax advice.
If not otherwise specified above, this page contains original content by Allio Advisors LLC. This content is for general informational purposes only.
The information provided should be used at your own risk.
The original content provided here by Allio should not be construed as personal financial planning, tax, or financial advice. Whether an article, FAQ, customer support collateral, or interactive calculator, all original content by Allio is only for general informational purposes.
While we do our utmost to present fair, accurate reporting and analysis, Allio offers no warranties about the accuracy or completeness of the information contained in the published articles. Please pay attention to the original publication date and last updated date of each article. Allio offers no guarantee that it will update its articles after the date they were posted with subsequent developments of any kind, including, but not limited to, any subsequent changes in the relevant laws and regulations.
Any links provided to other websites are offered as a matter of convenience and are not intended to imply that Allio or its writers endorse, sponsor, promote, and/or are affiliated with the owners of or participants in those sites, or endorses any information contained on those sites, unless expressly stated otherwise.
Allio may publish content that has been created by affiliated or unaffiliated contributors, who may include employees, other financial advisors, third-party authors who are paid a fee by Allio, or other parties. Unless otherwise noted, the content of such posts does not necessarily represent the actual views or opinions of Allio or any of its officers, directors, or employees. The opinions expressed by guest writers and/or article sources/interviewees are strictly their own and do not necessarily represent those of Allio.
For content involving investments or securities, you should know that investing in securities involves risks, and there is always the potential of losing money when you invest in securities. Before investing, consider your investment objectives and Allio's charges and expenses. Past performance does not guarantee future results, and the likelihood of investment outcomes are hypothetical in nature. This page is not an offer, solicitation of an offer, or advice to buy or sell securities in jurisdictions where Allio Advisors is not registered.
For content related to taxes, you should know that you should not rely on the information as tax advice. Articles or FAQs do not constitute a tax opinion and are not intended or written to be used, nor can they be used, by any taxpayer for the purpose of avoiding penalties that may be imposed on the taxpayer.