Updated March 18, 2024

Mike Zaccardi, CFA, CMT
Macro Money Monitor
Market Update
The S&P 500 was fractionally lower last week as internal jostling took place amid a modest rotation away from tech-related areas toward value sectors. All told, the SPX posted its second weekly loss in a row and the Nasdaq Composite underperformed. Strength was seen among resource stocks – Energy (now up five weeks running) and Materials posted solid gains as crude oil and copper prices rallied sharply. With a bump in Treasury yields, it had the inklings of price action from two years ago when the dollar was in rally mode, yields were on the rise, and an oil bull market was in full force. Small caps, which had appeared to be breaking out earlier this month, retreated more than 1% and the momentum trade took a breather.
In the fixed income market, the 10-year Treasury note’s selloff meant pain for rate-sensitive spots, like the Real Estate sector, though the embattled Utilities niche was not far from unchanged during the triple-witching options expiration week. Gold gave back a sliver of its year-to-date advance given the increase in real interest rates – the 10-year inflation-adjusted yield touched 2% for the first time in several months on Friday on the heels of warm inflation reports. Casting a bullish tone in the overall commodity complex was WTI’s jump above $80. Oil has been stair-stepping higher since December, and the prompt month of crude notched its best weekly settle since last October.
For the year, the S&P 500 is up 7.3% and the Nasdaq Composite is higher by 6.4%.
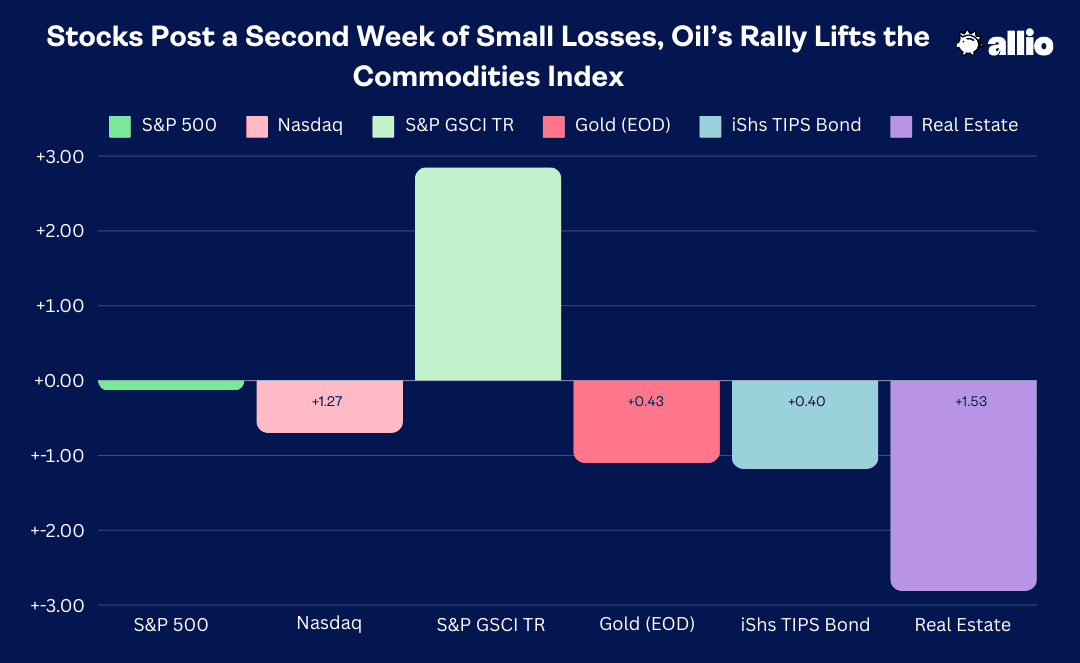
Source: Stockcharts.com
The Look Ahead
All eyes are on the Fed this week. Not only will the two-day FOMC gathering feature an interest rate decision and Powell’s presser, but we’ll also get the quarterly update on the Fed’s Summary of Economic Projections (SEP), also known as the dot plots. Following last week’s warm CPI and PPI reports, it’s probable that voting members will have turned more hawkish compared to their more sanguine stance regarding the outlook for monetary policy seen in December. While the path toward 2% PCE is drivable, there have clearly been some roadblocks as the first quarter has evolved. We’ll see how it all shakes out on Wednesday afternoon at the usual time. Volatility abroad could also come about early in the week as the BOJ is set to hike for the first time in 17 years, putting an end to its era of negative interest rates.
Elsewhere, there are a handful of significant economic reports, though the data deck is generally light after a busy one last week. Monday features a March update on the NAHB Housing Market Index, expected to show another decent sentiment score among homebuilders – recall that February’s 48 number was the highest in six months despite an uptick in lending rates. The average 30-year fixed mortgage rate has been bouncing around the 7% mark lately. Also on the real estate front, we will get February Building Permits and Housing Starts reports on the first day of Spring – both market data points are forecast to have improved sequentially.
Wednesday will be all about the Fed while Thursday morning will be busy for macro-onlookers. Initial Jobless Claims, which continue to show no signs of labor market weakness, hits at 8:30 a.m. ET along with March Philly Fed. The big data points of the morning will be S&P Global’s set of PMIs – both the Manufacturing and Services surveys hit the tape shortly after the opening bell, and a continued expansion is forecasted, though consensus estimates call for modest dips compared to February’s final numbers.
The week’s data wraps up on Thursday at 10 a.m. with The Conference Board’s Leading Economic Index, expected to show a 23rd straight monthly decline. Ironically, The Conference Board dropped its call for a US recession earlier this year. Existing Home Sales come at the same time, and a small month-over-month dip is expected.
Fed in Focus, Housing Market Data, S&P Global PMIs Are the Highlights
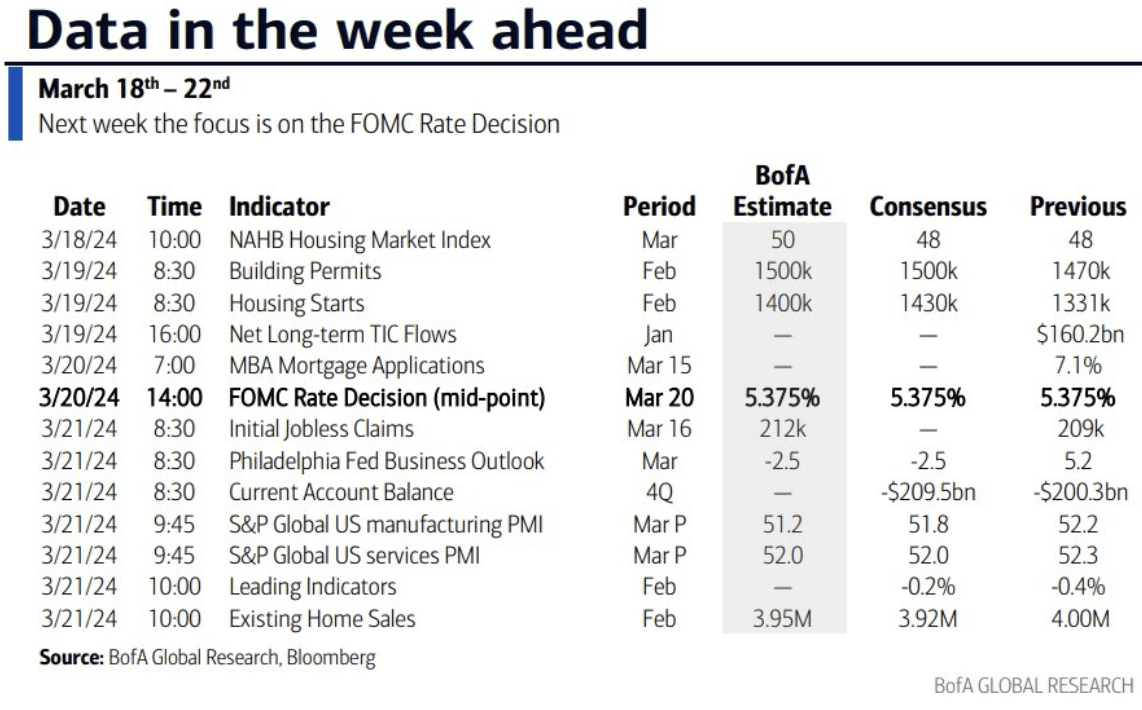
Source: BofA Global Research
Earnings Reports This Week
Off-season quarterly reports will be interesting over the days ahead, namely those from lululemon (LULU) and Nike (NKE) for reads on the consumer. Another soft Retail Sales number last week underscored the reality that spending is tapering off, particularly among low-end consumers. Nevertheless, we’ll see what the athleisure and apparel stalwarts have to say on that front.
A few companies from the Information Technology and Industrials sectors report on Monday while Tuesday should be rather uneventful as far as the macro is concerned. On Wednesday, we’ll get quarterly reports from China’s Pinduoduo (PDD), now about the same market cap size as fellow Consumer Discretionary company Alibaba (BABA), so that could rattle ETFs like FXI, ASHR, and MCHI which have been volatile lately. Speaking of volatility, the solar industry has been struggling - China’s Jinko Solar (JKS) reports in the pre-market Wednesday, too.
Back home, steady-Eddy General Mills (GIS) provides Q1 numbers along with Ollie’s (OLLI), another consumer stock. The focus then turns back to the chip space after the close when Micron (MU) offers quarterly results; a host of Consumer Discretionary companies follow suit. We must wait until Thursday AMC to hear from LULU and NKE – those reports, along with numbers from economic bellwether FedEx (FDX), may drive price action on Friday.
Also – be on the lookout for continued volatility in NVIDIA (NVDA), up 10 weeks in a row, as the glamour chip company hosts its annual four-day GTC Conference. CERAWeek takes place for Energy sector companies and Reddit (RDDT) shares are expected to begin trading on Wednesday.
China Stocks & Consumer Companies Report; Micron and FedEx Are Other Big Names Issuing Quarterly Results
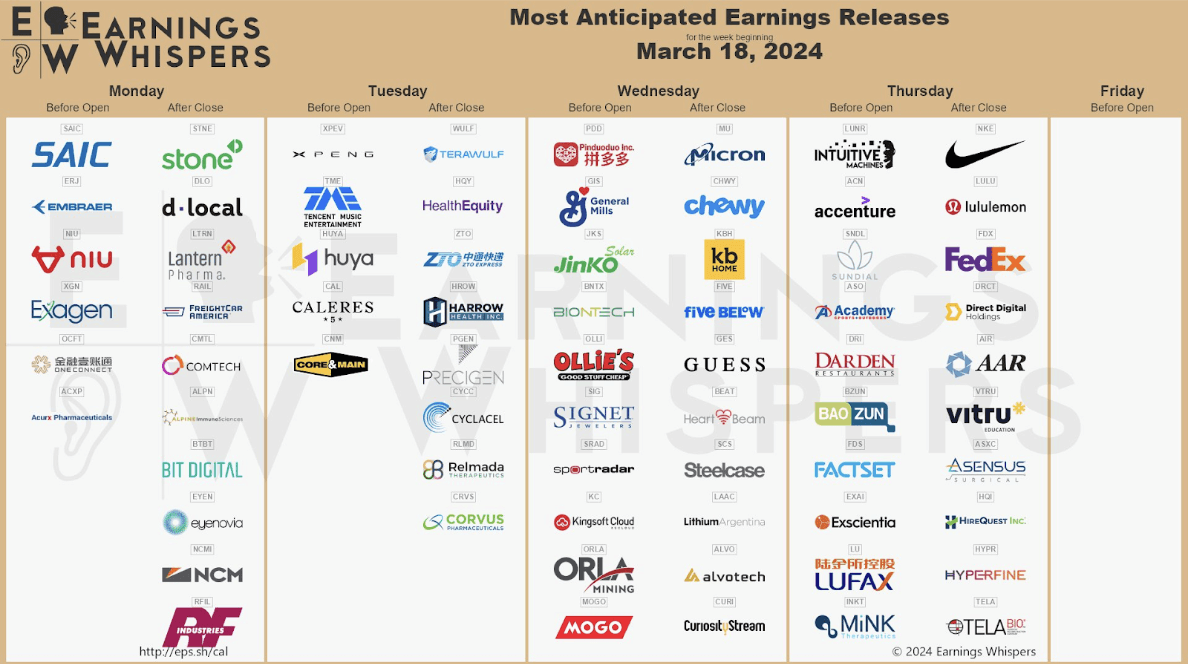
Source: Earnings Whispers
Topic of the Week: An Uneasy Feeling, But Party On
The bulls hoped that January’s economic data, which suggested inflation had hooked back up and consumer spending softened materially, would revert once the numbers were re-tallied in February and as the worst of winter came and went. That didn’t quite work out. Last week, it was a trio of concerning prints as far as those in the optimistic macro camp were concerned.
First, Tuesday’s CPI report verified a touch to the warm side. While the Headline month-over-month increase was in line with estimates, the Core rate was a tick above expectations. Both Headline and Core year-on-year increases were above what economists had predicted, too. Stocks took it all in stride, though, as the S&P 500 printed a fresh all-time closing high by the time the dust settled.
Traders may have taken solace in the fact that Core services ex-shelter CPI moderated to +0.5% last month compared to a hot +0.9% in January. Overall shelter inflation dipped to +0.4% sequentially. There is always an internal battle going on between Core Goods and Core Services CPI – the former accelerated to +0.11% last month while the latter eased to +0.46% after printing a multi-month high close to +0.7% to kick off the year. Goldman noted that core inflation was broadly disinflationary given a significant normalization in Core service ex-shelter.
February CPI Breakdown: YoY Inflation Driven by Core Services
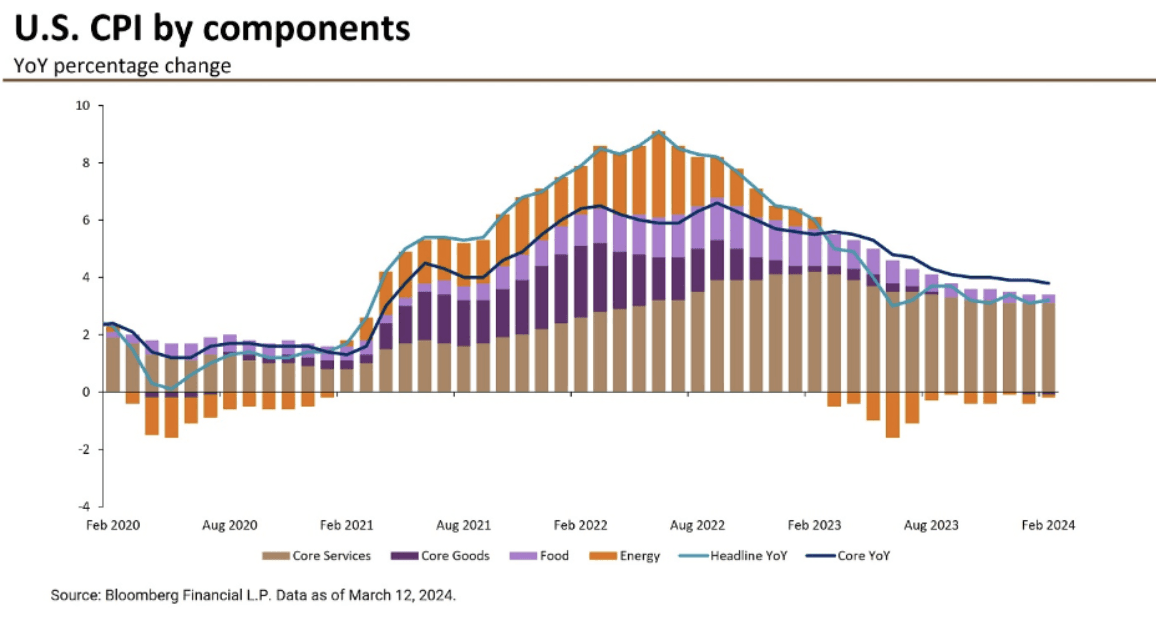
Source: J.P. Morgan Asset Management
Retail Sales Broadly Misses Economist’s Forecasts
Following Wednesday’s data lull, investors turned their attention to Retail Sales and PPI which hit the tape at the same time last Thursday morning. The Census Bureau’s Advance Retail Sales report was a disappointment nearly across the board. Forecasters called for a 0.8% monthly climb, but the actual number was just +0.6%. The Core Control group within the February report was flat following a 0.3% decline in the previous month.
Negative revisions to the January report affirmed a slowdown in consumer spending, and that surely resulted in lower GDP tracking estimates from both the Atlanta Fed’s GDPnow model and Wall Street economists. As it stands, Q1 real GDP for the US is seen at or perhaps slightly below 2%, a significant deceleration from outstanding growth in Q3 and Q4 2023.
February Retail Sales Were Tepid
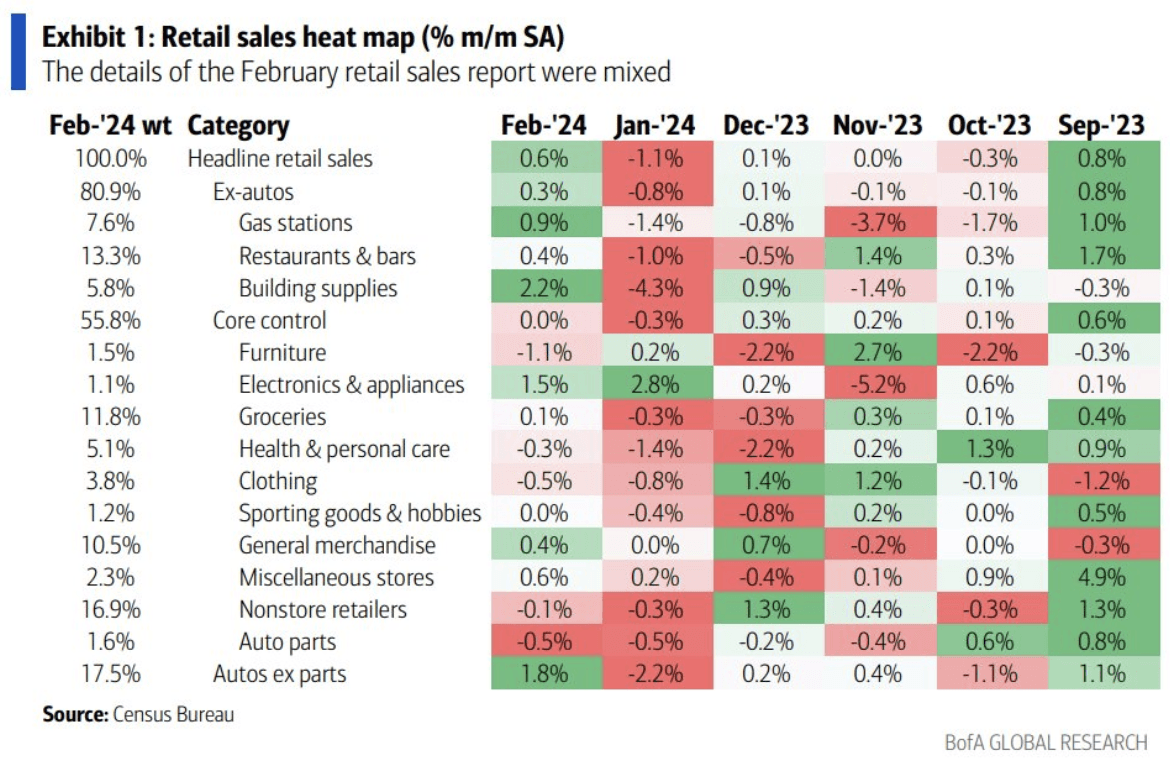
Source: BofA Global Research
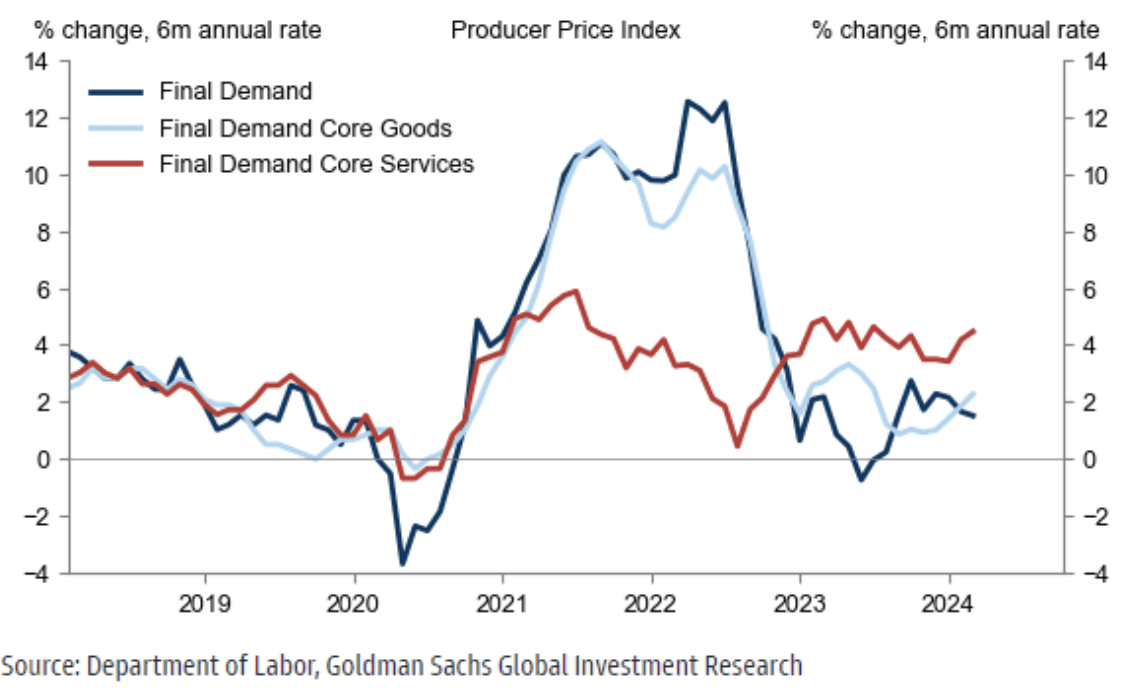
Producer Prices Came in Strong, Too
Stocks and bonds were resilient through mid-week, and the muted Retail Sales report likely wasn’t the culprit for Thursday’s bond market breakdown and stock selloff. It was a decidedly hot set of PPI numbers that drew worries among traders. A Headline 0.6% monthly jump in wholesale prices doubled the consensus forecast while Core and ex-trade PPI were likewise too warm for comfort. Many of the PPI components feed into PCE, the Fed’s preferred inflation gauge. The 10-year yield spiked after the bevy of data in the premarket, rising from below 4.2% to above 4.3%.
By now, you’re probably familiar with the refrain – higher interest rates and a stronger dollar meant bad news for areas like small caps and real estate while mega-cap tech outperformed the S&P 500 in the wake of Thursday’s data. Other key price action unfolded, though.
Core Producer Prices Stronger Than Expected in February
Source: Goldman Sachs
Oil Prices Back on the Rise, Moving in Tandem with Rates Once Again
WTI printed a four-month high by the close last Friday. Now above $80, a sneaky oil uptrend, along with jumpy gasoline prices, could further strain the consumer over the coming months. This is a strong period seasonally for the oil patch, and the rally comes amid the US Dollar Index’s best week since January and as interest rates marched higher. Throw it all together, and the Financial Conditions Index, something we wrote about last week, has turned tighter.
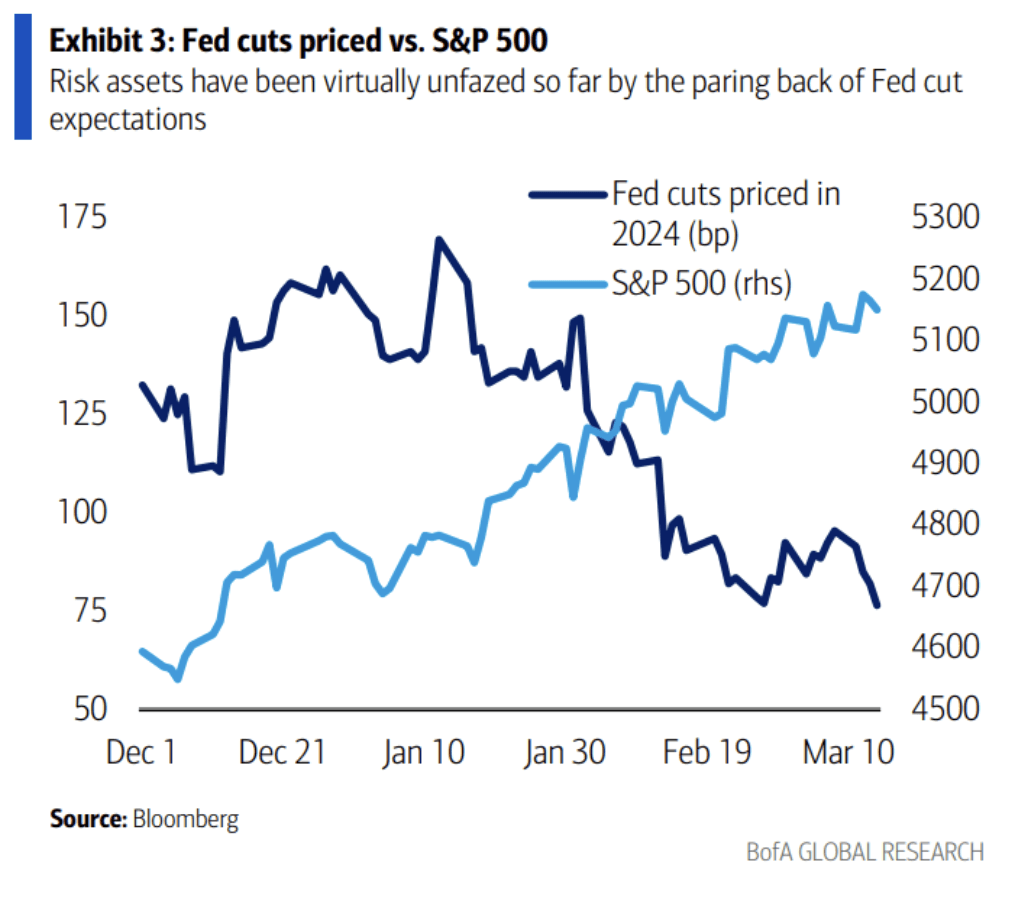
Not surprisingly, after all that data last week, rate traders have further pushed out expectations for the first Fed rate cut. Once seen as a high probability, the chance of a June ease is now drifting closer to a 50/50 chance. And there’s an increasing amount of chatter on the street that we might not get any policy rate cuts at all. It all depends, of course, on the data. If the string of uncomfortable inflation reports persists, that scenario could certainly unfold.
Stocks March Higher Despite Fewer Expected Rate Cuts
Source: BofA Global Research
Hope Springs Eternal Despite Less Easing Expected in 2024
But it’s not so much about when the first rate cut comes. In reality, a 5.38% effective Fed Funds rate is not all that much different from a 5.13% policy rate in today’s growth-focused economy, fueled by AI euphoria. About 20 basis points of projected cuts were taken off the board last week, and stocks barely budged.
In fact, according to data from EPFR, US equity funds took in the most investor dollars since March 2021 last week. Forget about ‘buy the dip,’ it’s a ‘buy whenever’ mindset right now. To that point, the S&P 500 has not even pulled back 2% since November last year. How long that kind of price action can persist is the question.
EPFR Reports a Humdinger Weekly US Fund Inflow

Source: BofA Global Research
For now, investors remain upbeat despite the troubling macro data. Goldman Sachs publishes its own sentiment barometer, and it spiked to astronomical levels in the most recent update. Now a full two standard deviations to the rosy side, positioning is universally bullish across retail, institutional, and foreign investors.
Sentiment Soars at the Start of Springtime

Source: Goldman Sachs
The Bottom Line
It has been a quiet two weeks of S&P 500 price action - if you want March Madness, you might have to stick with college basketball. Massive gains since October last year are being digested and sector rotation is alive and well. Despite concerning macro data points and rising oil prices, investor sentiment is buoyant. Will Chair Powell and the Fed interrupt the tune this week? That is the big question on Wall Street.
Want access to your own expert-managed investment portfolio? Download Allio in the app store today!
Related Articles


The articles and customer support materials available on this property by Allio are educational only and not investment or tax advice.
If not otherwise specified above, this page contains original content by Allio Advisors LLC. This content is for general informational purposes only.
The information provided should be used at your own risk.
The original content provided here by Allio should not be construed as personal financial planning, tax, or financial advice. Whether an article, FAQ, customer support collateral, or interactive calculator, all original content by Allio is only for general informational purposes.
While we do our utmost to present fair, accurate reporting and analysis, Allio offers no warranties about the accuracy or completeness of the information contained in the published articles. Please pay attention to the original publication date and last updated date of each article. Allio offers no guarantee that it will update its articles after the date they were posted with subsequent developments of any kind, including, but not limited to, any subsequent changes in the relevant laws and regulations.
Any links provided to other websites are offered as a matter of convenience and are not intended to imply that Allio or its writers endorse, sponsor, promote, and/or are affiliated with the owners of or participants in those sites, or endorses any information contained on those sites, unless expressly stated otherwise.
Allio may publish content that has been created by affiliated or unaffiliated contributors, who may include employees, other financial advisors, third-party authors who are paid a fee by Allio, or other parties. Unless otherwise noted, the content of such posts does not necessarily represent the actual views or opinions of Allio or any of its officers, directors, or employees. The opinions expressed by guest writers and/or article sources/interviewees are strictly their own and do not necessarily represent those of Allio.
For content involving investments or securities, you should know that investing in securities involves risks, and there is always the potential of losing money when you invest in securities. Before investing, consider your investment objectives and Allio's charges and expenses. Past performance does not guarantee future results, and the likelihood of investment outcomes are hypothetical in nature. This page is not an offer, solicitation of an offer, or advice to buy or sell securities in jurisdictions where Allio Advisors is not registered.
For content related to taxes, you should know that you should not rely on the information as tax advice. Articles or FAQs do not constitute a tax opinion and are not intended or written to be used, nor can they be used, by any taxpayer for the purpose of avoiding penalties that may be imposed on the taxpayer.