Updated September 5, 2023

Mike Zaccardi, CFA, CMT
Macro Money Monitor
Market Update
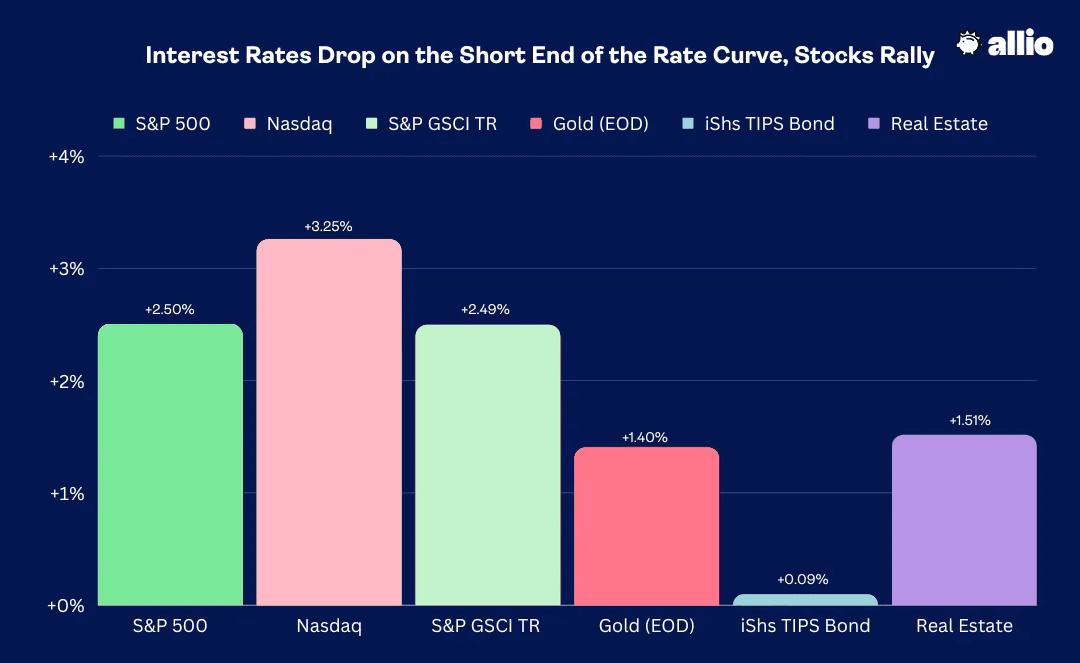
The S&P 500 finished August with a flourish, rising 2.5% last week, while the Nasdaq Composite outperformed with a 3.3% total return. Amid labor market indicators that suggest some cooling off in the jobs market, bonds on the short end of the Treasury curve caught a bid, helping to bring the TIPS ETF in the black ahead of the unofficial end to summer. The Real Estate sector was up for a similar reason, but the embattled area underperformed the broader market.
More bullish price action was seen in commodities despite the US dollar posting an up week – WTI crude oil topped $85 by Friday, leading the GSCI Commodities Index to a 2.5% advance. Gold also worked in the data-heavy but volume-light trading week.
August 25, 2023 - September 1, 2023
The Look Ahead
Put the bathing suits away and scurry those kids back to school. Vacation season is over. The first two weeks of September often feature sideways price action before more bearish seasonal trends kick in. There isn’t too much to write home about this week, though.
We will get a July read on Durable Goods and Factory Orders Tuesday morning after the long weekend, trade balance data, and then the final look at August S&P Global US Services PMI on Wednesday during the trading day. Investors will closely analyze the August ISM Services survey to be released at 10 a.m. ET Wednesday, too, before the Fed’s Beige Book crosses the wires that afternoon. Initial Jobless Claims will again be in focus following a tame figure on August 31.
The week ends with Wholesale Inventories on Friday morning – usually an uneventful indicator. But keep your eye on the Manheim Used Vehicle Value Index which hits the tape on Friday – it's a key driver of near-term inflation.
In terms of Fed noise, Lorie Logan, Dallas Fed President, speaks Tuesday afternoon and John Williams of the New York Fed and Governor Bowman speak Wednesday afternoon.
It’s also a light week on the earnings front. C3.ai (AI) reports Wednesday afternoon along with GameStop (GME). DocuSign (DOCU) has earnings Thursday evening as does the high-end consumer company RH (RH). Perhaps the most prominent Q2 look comes from Kroger (KR) Friday before the bell.
Cooling Off. Kinda, Sorta.
Macro investors had their hands full sifting through all the jobs market data that came rolling in last week. Interestingly, it wasn’t Friday’s official August payrolls report that drove price action. No, it was Tuesday morning’s July glimpse at the Job Openings and Labor Turnover Survey (JOLTS).
Fed Chair Powell has stated in previous press conferences that the JOLTS numbers are something he and the rest of the FOMC keep tabs on, so the 8.83 million figure, much weaker than the 9.47 million consensus number of openings and the lowest level since March 2021, was particularly market moving.
JOLTS: The Number of Job Openings Trends Lower, A Sign of a Cooling Labor Picture
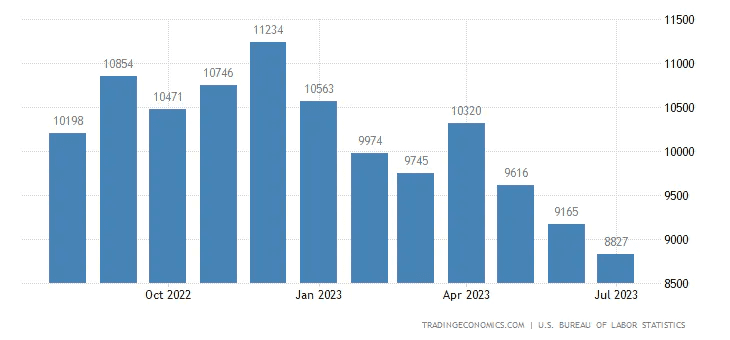
Source: TradingEconomics
Measuring the Labor Market Is Tricky
The JOLTS survey is murky for some investors. Here’s how it works: The Bureau of Labor Statistics surveys a sample of businesses and government entities to get data on job openings, hires, quits, layoffs, and other labor market dynamics. It's a bit of an arcane process involving phone calls, and the response rate has dropped big in the last few years, so its accuracy is often questioned by pundits. There’s also doubt on the report’s validity since many remote jobs are posted multiple times across many states. Still, the clear trend is lower in the number of openings, indicating a loosening up of labor market conditions.
Job Openings Drop in July
And that is exactly what we saw last week. Along with a third straight month of fewer job openings, the total number of job quitters eased from 3.80 million in June to 3.55 million for July. In all, the report indicated that the Fed’s goal of pumping the brakes on the employment situation is working. That narrative played out again on Wednesday morning last week, care of the August ADP Employment Change report focused on the private sector. This gauge is another with a poor accuracy rate compared to the government’s official labor report, but it too came in light at just 177,000 private sector jobs added for August.
ADP Employment Change for August: Tepid Small Business Growth
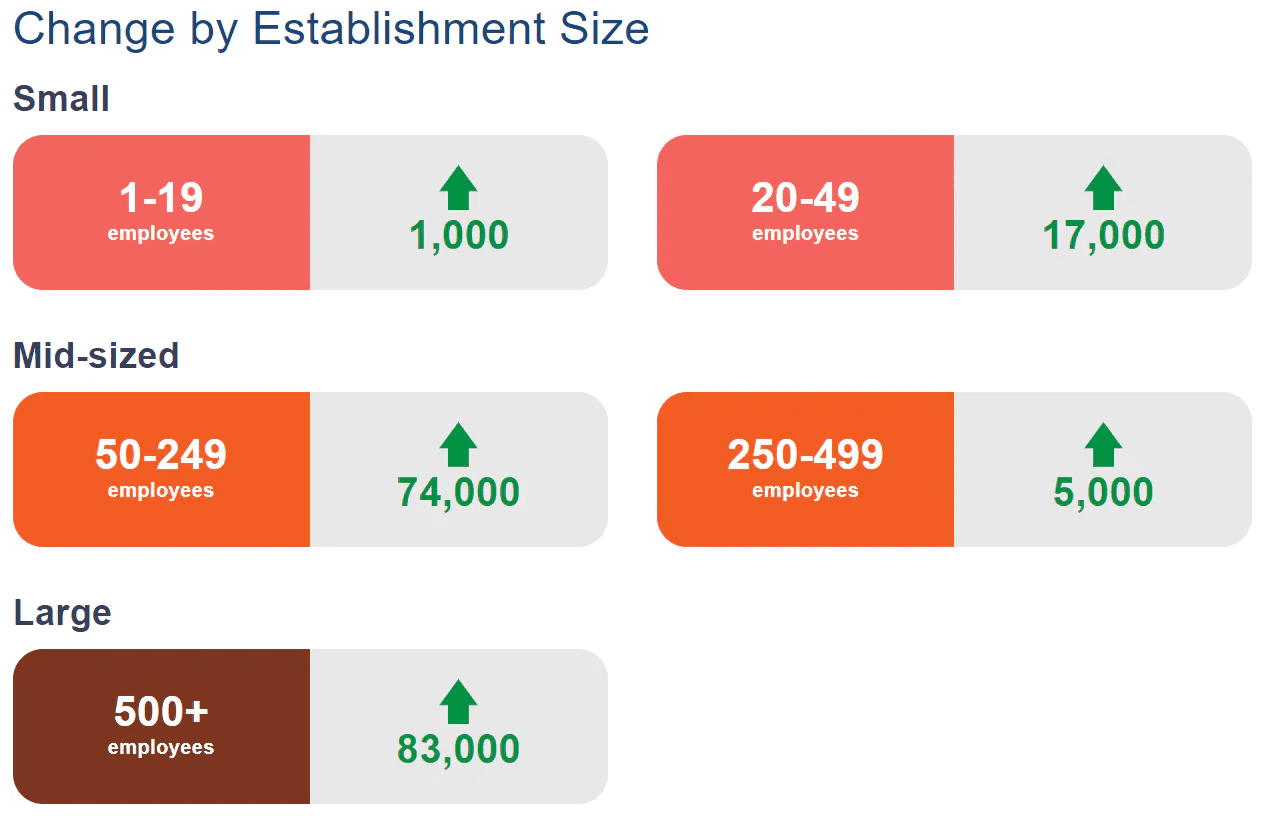
Source: ADP
Job Cuts Jump, More People Coming into the Labor Market
There was also a pick-up in corporate layoffs as reported by the consulting firm Challenger, Gray & Christmas, though Thursday’s jobless claims figures were once again indicative of a firm labor market. Finally, Friday’s August nonfarm payrolls report came in slightly better than expected with 187,000 jobs added, compared with the consensus estimate of 170,000. Importantly, there were 110,000 jobs lost via revisions to the June and July surveys.
That makes for an interesting twist of a continued fall off in the broader employment-growth trend, but there is now an acceleration of positions added when focusing strictly on the June through August stretch. Still, like Powell’s speech a week earlier, there was something for the hawks and doves to each focus on.
Interpreting All that Employment Data
In our view, the big takeaway was the uptick in the unemployment rate. That means a recession is more likely, right? Not so fast. The driver of the 0.3 percentage point rise was actually for good reason – the labor force expanded. More people re-entered the jobs market, and that is maybe a sign that people are confident about the quality of work they can land. At 3.8%, the unemployment rate is now at the highest mark in 18 months while the “underemployment rate,” the U-6 reading, also rose to its highest level since May of last year. With average hourly earnings coming in light at just +0.2% on a month-over-month basis, the report underscored a near-term slowdown, but that the jobs market was still modestly tight.
The U-6 Underemployment Rate Rises to 7.1%
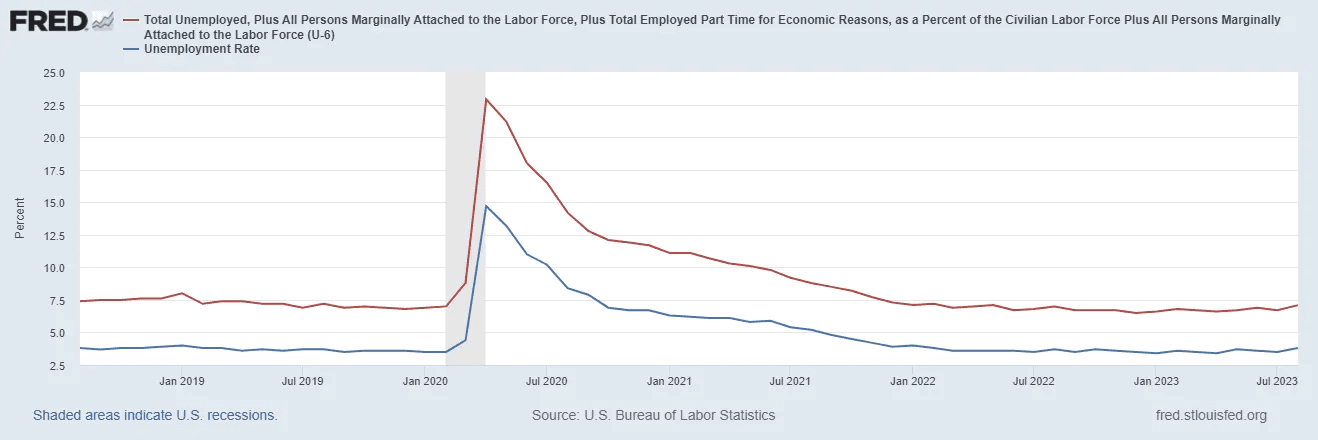
Source: St. Louis Federal Reserve
The Bond Market’s Reaction: Short-End Buying, Long-End Selling
Following Tuesday’s JOLTS jolt to stocks, equities meandered after the NFP figures were released Friday morning. More significant moves were seen in the Treasury market – namely the Long Bond (30-year Treasury bond). Its yield had dipped to 4.18% by late Thursday last week, the lowest since August 10, but then it jumped back above 4.3% after traders digested a bevy of economic data Friday morning, which included an ISM Services report that revealed stronger than forecasted Employment and Prices Paid components. The yield curve flattened out with the rate difference between the 2-year note and the 10-year note rising to just under –0.7 percentage point.
Wake Me Up in September? No Volatility Alarm Bells Ringing.
That’s a lot for investors to take in – oh, and there were key home price data and inflation readings tossed into the mix. Ironically, equities were little changed after Tuesday. The final three days before the long holiday weekend were uneventful if you simply gazed at the charts. The S&P 500 ranged from just 2% over that stretch, something I find encouraging.
You see, one way to read the tape is to analyze how the bulls and bears battle it out after a rally: Are profits taken or do the gains hold? Last week, the SPX built on its August bounce back even as pessimism and downright fear permeated ahead of the notorious September and October stretch. Another indicator pointing to the market’s tranquility is the VIX – Wall Street “fear gauge” has traded lower intraday in each of the previous six sessions, closing last week at nearly its lowest mark since early 2020.
Volatility Index Back Near 13 as September Gets Underway
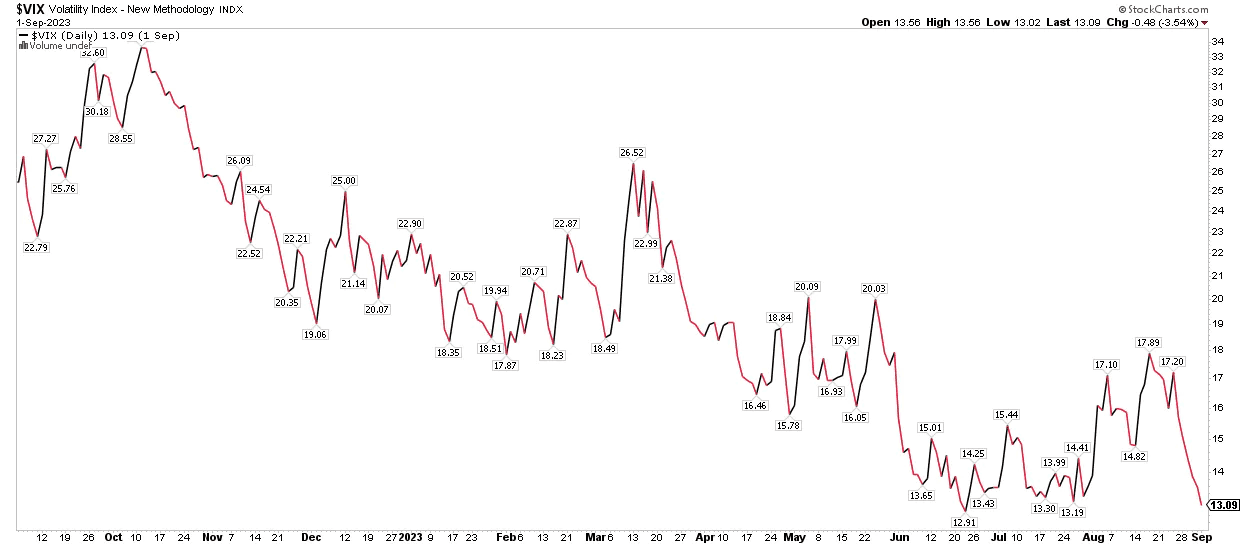
Source: Stockcharts.com
Use Seasonality with Prudence
We remain cautiously optimistic about where stocks go from here. Seasonality should never be used in isolation, or even as a primary driver of a market outlook. Rather, it is a secondary indicator at best and there’s always nuance to it. Consider that September is not all that bad during the first half of the month (the real volatility does not historically kick in until the 17th).
What’s more, when the S&P 500 is positive by a healthy amount going into this purportedly dreaded month, returns are actually just fine. We mentioned this reality last week over on the Alpha. It’s just a reminder not to get caught up in a scary and compelling narrative you might hear about on TV or see on X.
Walking, Not Hiking, to the Soft-Landing Camp
Fundamentally, the bearish case is getting harder to make. With the hiring market cooling off after being red hot throughout 2022 and as inflation gradually pulls back, the Fed’s job is getting easier. We harped on that last week following Jay’s Jackson Hole melodic missive, and the chance of a rate hike on September 20 is now almost off the board. If we get a pair of sanguine CPI reports this month and next, then there is a good chance that we can count out a November 1 hike, too.
S&P 500 EPS Outlook Quietly Looks Rosier
Optimism on the monetary policy front comes as Wall Street strategists turn more hopeful on corporate profits. Since the start of the third quarter reporting period, estimates for aggregate S&P 500 EPS are on the rise. This year’s per-share profit total is seen at $222, up from a trough of $218 a month and a half ago. Calendar year 2024 EPS is seen at $249, also inflecting higher in mid-July.
Does it make stocks cheap today? Eh, probably not. If the SPX holds here and the consensus earnings expectation remains the same, then we are talking about an 18.1 forward P/E multiple – fair maybe, but not overly cheap. Taking a step back, it’s unusual to see earnings estimates increase. The common pattern is for top-down strategists to set the bar too high, and then gradually reduce their forecasts over time.
An Unexpected Tag Team: Oil & the Dollar Laying the Smackdown
From a macro level, some areas could weigh on equities in the weeks ahead. Surprising many traders has been the sustained move higher in oil. US crude settled above $85 per barrel last Friday, the highest since mid-November 2022. The dollar, meanwhile, has moved up in tandem with WTI. The greenback closed above 104, its best mark since turmoil in the Financials sector this past March.
Normally, a stronger USD pressures dollar-denominated commodities, but we aren’t seeing that this time. Why? Well, along with higher long-term interest rates, it might just be a sign that economic improvement is borne out in price action. While there are plenty of bearish market signals, this intermarket dynamic is somewhat encouraging.
WTI Crude Oil: Highest Daily Close Since November 15, 2022
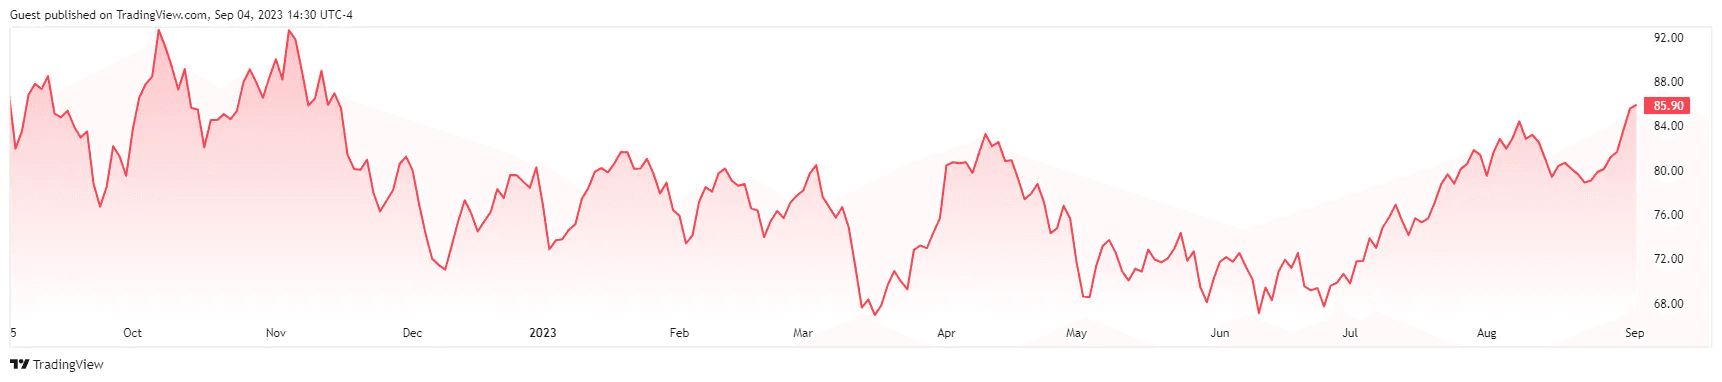
Source: TradingView
US Dollar Index Continues Its March Higher After Bottoming in July
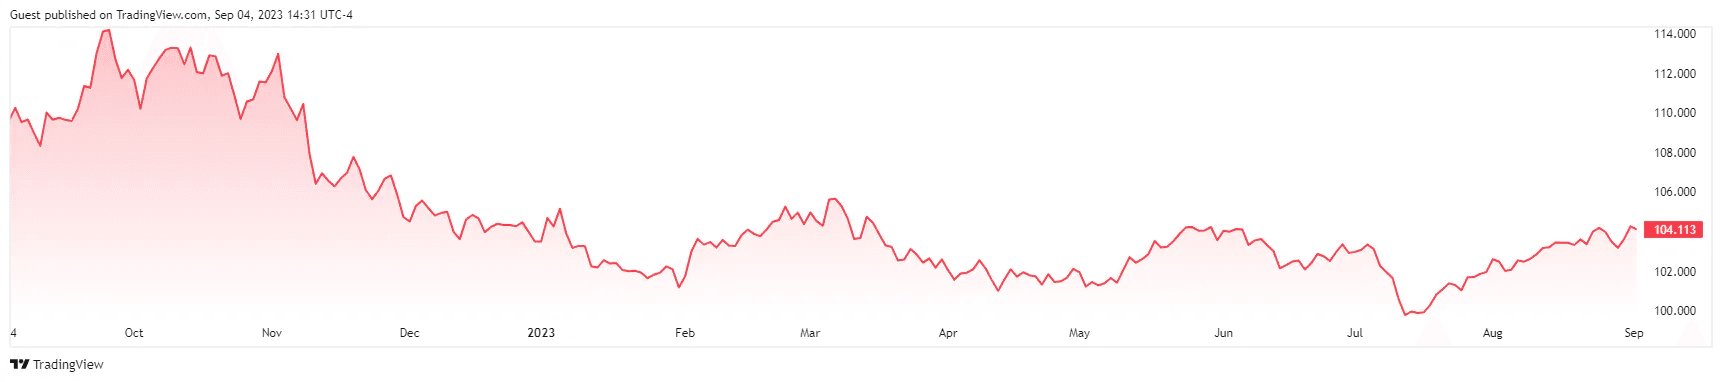
Source: TradingView
The Bottom Line
Back to school, autumn breezes, the return of football, pumpkin-spice everything, and September volatility. These are just some of our favorite things this time of year.
What if, though, that 6% retreat was all we’ll get? It is a scenario that investors holding ample amounts of cash must grapple with. Still, there are headwinds including $85 oil, a rip-roaring dollar, and long-term interest rates not far from their cycle highs.
Want access to your own expert-managed investment portfolio? Download Allio in the app store today!
Related Articles


The articles and customer support materials available on this property by Allio are educational only and not investment or tax advice.
If not otherwise specified above, this page contains original content by Allio Advisors LLC. This content is for general informational purposes only.
The information provided should be used at your own risk.
The original content provided here by Allio should not be construed as personal financial planning, tax, or financial advice. Whether an article, FAQ, customer support collateral, or interactive calculator, all original content by Allio is only for general informational purposes.
While we do our utmost to present fair, accurate reporting and analysis, Allio offers no warranties about the accuracy or completeness of the information contained in the published articles. Please pay attention to the original publication date and last updated date of each article. Allio offers no guarantee that it will update its articles after the date they were posted with subsequent developments of any kind, including, but not limited to, any subsequent changes in the relevant laws and regulations.
Any links provided to other websites are offered as a matter of convenience and are not intended to imply that Allio or its writers endorse, sponsor, promote, and/or are affiliated with the owners of or participants in those sites, or endorses any information contained on those sites, unless expressly stated otherwise.
Allio may publish content that has been created by affiliated or unaffiliated contributors, who may include employees, other financial advisors, third-party authors who are paid a fee by Allio, or other parties. Unless otherwise noted, the content of such posts does not necessarily represent the actual views or opinions of Allio or any of its officers, directors, or employees. The opinions expressed by guest writers and/or article sources/interviewees are strictly their own and do not necessarily represent those of Allio.
For content involving investments or securities, you should know that investing in securities involves risks, and there is always the potential of losing money when you invest in securities. Before investing, consider your investment objectives and Allio's charges and expenses. Past performance does not guarantee future results, and the likelihood of investment outcomes are hypothetical in nature. This page is not an offer, solicitation of an offer, or advice to buy or sell securities in jurisdictions where Allio Advisors is not registered.
For content related to taxes, you should know that you should not rely on the information as tax advice. Articles or FAQs do not constitute a tax opinion and are not intended or written to be used, nor can they be used, by any taxpayer for the purpose of avoiding penalties that may be imposed on the taxpayer.