Updated October 23, 2023

Mike Zaccardi, CFA, CMT
Macro Money Monitor
Market Recap
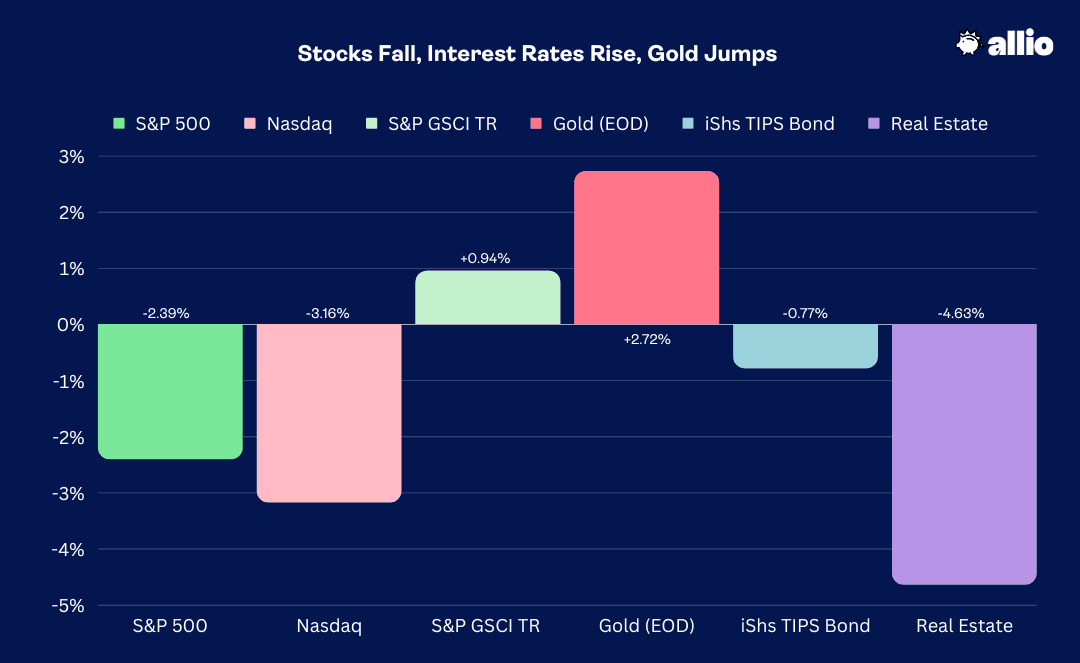
Stocks sold off hard over the back half of last week. In all, the S&P 500 fell 2.4% with the Nasdaq Composite giving back more than 3% as the megacaps began reporting Q3 results. Energy and Consumer Staples were the only positive sectors while Real Estate, the notable laggard, continues to endure a painful year, largely the result of steeply rising interest rates. The Consumer Discretionary sector was also soft, losing nearly 5%, following disappointing earnings results from Tesla – the EV automaker skidded to its worst week of the year.
In fixed income, the 10-year Treasury yield surged another 30 basis points last week, sneaking a peek at 5% on Thursday before late-week bond buying brought yields off the highs. Interestingly, Treasury-Inflation Protected Securities ETF (TIP) significantly outperformed nominal Treasuries – a sign that inflation expectations are on the rise. The culprit? Oil. The price of a barrel of WTI rallied from an October low of under $82 to flirt with $90 late last week as geopolitical tensions remained elevated. Finally, gold has surged 9% over the last 10 trading sessions even with a jump in real yields. The overall commodity complex climbed 0.9% last week.
October 13, 2023 - October 20, 2023
The Look Ahead
It’s another busy stretch on the macro data front. We’ll get first reads on October US PMIs from S&P Global on Tuesday morning – the consensus calls for readings near 50, the demarcation between economic expansion and contraction. Housing market data continues to roll in with New Home Sales figures for September hitting Wednesday at 10 a.m. ET. The real action takes place Thursday morning when a deluge of data drops.
The Jobless Claims report arrives at the usual time while an advance look at Q3 GDP also comes at 8:30 a.m. ET. Estimates call for hot growth numbers, perhaps north of 4% on an annualized basis from a quarter earlier. Durable Goods Orders are seen as having climbed during September – that's another data point that will impact Treasury markets and, hence, equity futures on Thursday. Following Pending Home Sales later that morning, key inflation numbers cross the wires on Friday before the bell. While the Fed closely monitors Personal Consumption Expenditure (PCE) data, there’s high confidence that a rate hike is not in the cards at the November 1 FOMC meeting. Finally, a last update to the October University of Michigan Consumer Sentiment report rounds out what could be another wild week.
Earnings Reports This Week
With 17% of S&P 500 companies having reported Q3 results, the beat rate is nothing out of the norm at 73%, according to FactSet. The consensus now calls for an aggregate EPS decline of -0.4%, which would be the fourth consecutive quarterly earnings drop. FactSet notes that companies are reporting earnings that are 6.6% above estimates, equal to the 10-year average, though there was a tick lower in CY 2023 EPS forecasts last week.
After mixed reactions from Netflix (NFLX) and Tesla (TSLA) last week, we will hear from four of the mega-cap tech names: Microsoft (MSFT) and Alphabet (GOOGL) after the bell on Tuesday, Meta (META) Wednesday afternoon, and Amazon (AMZN) Thursday evening. Other big names posting Q3 results include Coca-Cola (KO) and Verizon (VZ) Tuesday BMO, Boeing Wednesday morning, IBM (IBM) Wednesday AMC, UPS (UPS) Thursday BMO, and the oil giants ExxonMobil (XOM) and Chevron (CVX) Friday BMO.
Earnings Season Rolls On
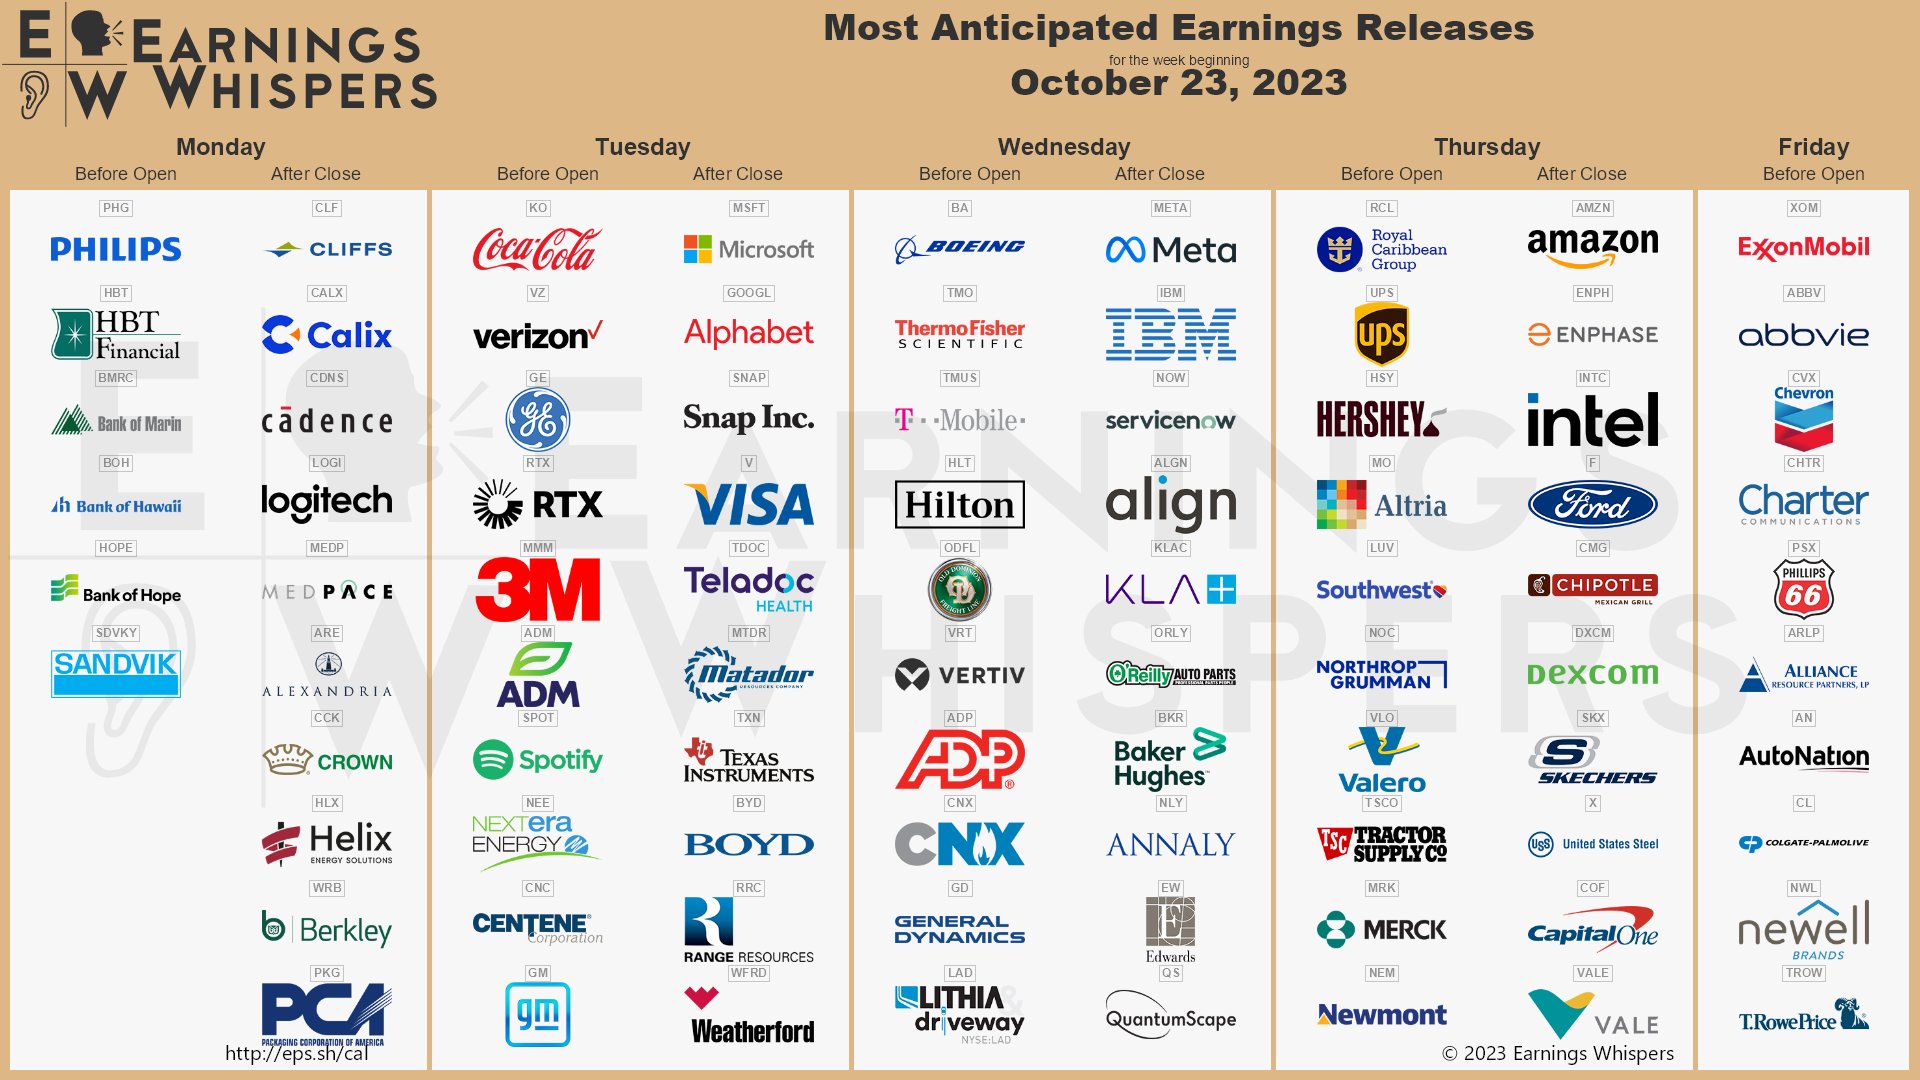
Source: Earnings Whispers
Topic of the Week: Almost There
The Fed is going to hold its target policy rate in the 5.25-5.50% range at the November 1 meeting. So-called Fed Speak was intense in the last two weeks with one FOMC member after another offering sometimes cryptic and sometimes straightforward messaging on what their next move might be. Chair Powell remained hawkish for the most part during his conversation with the Economic Club of New York last Thursday.
As it stands, the CME FedWatch Tool shows a greater than 99% probability of a November pause. There remains, however, about a one-in-three chance of an additional hike. We are almost there in terms of when the Fed can message to the market that it has reached sufficiently restrictive monetary policy through its rate-hiking campaign. At the same time, significant quantitative tightening has drained significant liquidity from the system.
Fed Enters Its Blackout Period
A bevy of comments from FOMC members, and words from the Wall Street Journal’s Nick Timiraos, basically cemented the November holding pattern, making this week’s PCE data not as crucial as it otherwise might have been. The December 13 meeting will come after a pair of US jobs reports and October CPI - a hike cannot be ruled out since the trend of hot data (see: September Nonfarm Payrolls, CPI, and Retail Sales) shows no signs of abating.
Surprise! More Strong Data Sparks Bond-Market Selling
I keep close tabs on the Citigroup Economic Surprise Index, and it has been firmly above zero for the last three months, indicating better-than-expected data. “Good news is bad news” has been the general mantra for markets in the second half, evidenced by rapidly rising interest rates and increasingly bullish expectations for third-quarter economic expansion. We can chart that, too.
The consensus estimate for Q3 US real GDP growth was under 1% when the second-quarter earnings season began in mid-July – it all started with a hot June Retail Sales report. That’s also when signs that the domestic economy was re-accelerating became apparent. The 10-year yield went on to rally from about 3.75% in July to 5% at its peak last week, and traders now see 4% Q3 real GDP growth.
Americans Keep on Spending
All signs indeed suggest Q3 ended with a boom. Last week’s September Retail Sales data stunned Wall Street. It was a third straight month of robust consumer spending, helping to lift the Atlanta Fed’s GDPnow tracker further above 5% for the quarter that just ended. All said, barring negative revisions, Q3’s Retail Sales ran at a much-too-hot annualized rate of above 6%. The report’s internals were impressive and there were upward revisions to prior months. The control group, which removes volatile components, jumped 0.6%, helping to confirm that this week’s GDP figure will likely be impressive. Spending might keep up, too, considering that gas prices across the country are near $3.50 - down 10% from the September peak.
Where Are the Layoffs?
Yields continued their climb following the strong numbers, but stocks actually acted well through midday on Tuesday. Both the S&P 500 and Russell 2000 took the data in stride, but afternoon selling set the tone for the rest of the week. Then on Thursday, the Department of Labor reported that jobless claims fell to just 198,000 for the previous week – the least since January and well below the 210,000 consensus estimate. For this time of year, it tied for the lowest going back to 1968. While the Fed may be ‘almost there’ in terms of ending its rate-hike cycle, ongoing tightness in the jobs market may keep inflation elevated.
Jobless Claims Are Lower from Year-Ago Levels, Mildest Since 1968 For That Week on the Calendar

Source: The Daily Shot
Oil’s Jump Stirs Up Inflation Jitters
We see inflation fears in price action. One chart making the rounds on Wall Street right now is a comparative look at the TIPS ETF versus the intermediate-term Treasury ETF (IEF). The chart below shows the relative strength of inflation-protected Treasuries versus nominal notes.
In short, when the line rises, it indicates increasing inflation expectations. The implication through this technical lens is that further TIP upside may be in store following a year-long basing pattern. You don’t have to be a technical analyst to spot the jump in inflation expectations. Macro analysts can also look to both the inflation swaps futures market and TIPS breakeven yields – both have moved higher in recent weeks.
TIPS ETF Rallying Compared to Nominal Treasuries: Inflationary Implications

Source: Stockcharts.com
10-Year Inflation Breakeven Rate Hits 7-Month Highs
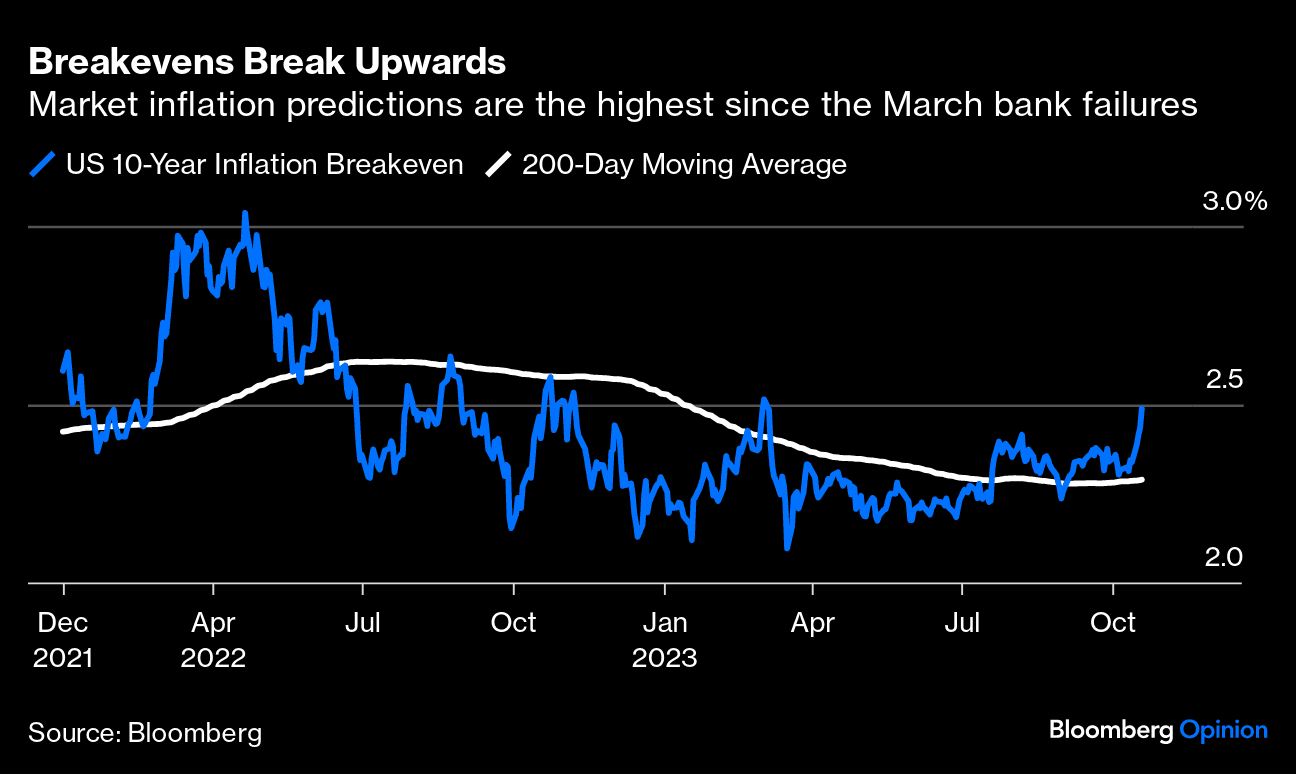
Source: Bloomberg
WTI & Brent Rally After a Mid-October Dip
TIP’s relative resurgence may just be a bullish move in crude oil. Consider the charts above in the context of what WTI has done since late in Q3. It was just five months ago when oil was on the decline amid rising global recession fears. A barrel cost about $65, and oil volatility was notably absent. My how things have changed; both WTI and Brent crude are near 52-week highs on a weekly basis as the Israel-Hamas war rages on.
Investors Flock to Gold
The conflict in the Middle East has helped send gold soaring. The 9% two-week advance is among gold’s best performances of the last decade, and it sent the safe-haven commodity to within earshot of a new all-time weekly high close. All told, gold finished the week at $1994, having topped the $2000 mark at times last Friday, and the yellow metal is at all-time highs when pricing it in euros or yen.
A general risk-off trading atmosphere was in play to cap off the volatile week. Stocks sold off into Friday's close while Treasury yields dipped. It had the feeling of traders not wanting to go home long risk assets ahead of what could be a dicey weekend on the geopolitical front. That cautious intermarket price action was similar to how the previous Friday afternoon unfolded.
Volatility Makes an October Comeback
There’s clearly an underlying fear in the marketplace. Gold’s on the rise, oil has been resilient, and the VIX settled last week at its highest mark since right after the SVB crisis in March. Those macro realities are seen in both positioning data and investor sentiment – both of which are generally to the bearish side. It all comes as seasonal strength normally gets underway in late October. The wall of worry is no doubt in place.
Volatility Hurdles the 20 Level as Fear Tightens Its Grip on Wall Street

Source: TradingView
Bond Investors Stepping Out on the Risk Curve?
Finally, there was an interesting trend last week in fund flow data. BofA research pointed out that outflows from money market funds notched a record. It’s anyone’s guess as to what drove the repositioning, but investors may be ‘buying the dip’ so to speak in the bond market. Consider that yields in the belly of the curve and further out are much more attractive today than just a few months ago.
The aggregate bond market’s yield-to-maturity is 5.7% while long-term rates have risen closer to money market yields as the Treasury curve has flattened. Friday’s last print on the closely-watched 2-year/10-year spread was 16 basis points – a 52-week low in terms of the inversion level.
The Bottom Line
US economic data keeps running strong, and Q3 will undoubtedly have shown a reacceleration in real GDP growth. While this week’s PCE inflation data won’t move the needle on chances for a Fed rate hike next week, the Treasury market will keep a close watch. Corporate earnings reports, meanwhile, offer clues into how executives see the 2024 landscape.
Want access to your own expert-managed investment portfolio? Download Allio in the app store today!
Related Articles


The articles and customer support materials available on this property by Allio are educational only and not investment or tax advice.
If not otherwise specified above, this page contains original content by Allio Advisors LLC. This content is for general informational purposes only.
The information provided should be used at your own risk.
The original content provided here by Allio should not be construed as personal financial planning, tax, or financial advice. Whether an article, FAQ, customer support collateral, or interactive calculator, all original content by Allio is only for general informational purposes.
While we do our utmost to present fair, accurate reporting and analysis, Allio offers no warranties about the accuracy or completeness of the information contained in the published articles. Please pay attention to the original publication date and last updated date of each article. Allio offers no guarantee that it will update its articles after the date they were posted with subsequent developments of any kind, including, but not limited to, any subsequent changes in the relevant laws and regulations.
Any links provided to other websites are offered as a matter of convenience and are not intended to imply that Allio or its writers endorse, sponsor, promote, and/or are affiliated with the owners of or participants in those sites, or endorses any information contained on those sites, unless expressly stated otherwise.
Allio may publish content that has been created by affiliated or unaffiliated contributors, who may include employees, other financial advisors, third-party authors who are paid a fee by Allio, or other parties. Unless otherwise noted, the content of such posts does not necessarily represent the actual views or opinions of Allio or any of its officers, directors, or employees. The opinions expressed by guest writers and/or article sources/interviewees are strictly their own and do not necessarily represent those of Allio.
For content involving investments or securities, you should know that investing in securities involves risks, and there is always the potential of losing money when you invest in securities. Before investing, consider your investment objectives and Allio's charges and expenses. Past performance does not guarantee future results, and the likelihood of investment outcomes are hypothetical in nature. This page is not an offer, solicitation of an offer, or advice to buy or sell securities in jurisdictions where Allio Advisors is not registered.
For content related to taxes, you should know that you should not rely on the information as tax advice. Articles or FAQs do not constitute a tax opinion and are not intended or written to be used, nor can they be used, by any taxpayer for the purpose of avoiding penalties that may be imposed on the taxpayer.