Updated October 3, 2023

Mike Zaccardi, CFA, CMT
Macro Money Monitor
Market Recap
Stocks ended the quarter on a down note. The S&P 500 fell less than one percent though both the Nasdaq 100 and small caps managed to eke out narrow gains. A volatile stretch in the bond market resulted in losses for the TIPS ETF and more underperformance among real estate equities. Commodities were mixed, but the group featured modest losses as the US Dollar Index made it 11 consecutive weekly advances.
Rising real rates have finally taken their toll on the gold market – the precious metal fell all five days last week to close at its lowest level since March. Energy was the lone sector in the black to round out the third quarter as oil prices flirted with the mid-$90s at times before finishing September under $91. The defensive Utilities and Consumer Staples sectors fared the worst.
For the month, the S&P 500 declined 4.9%, making it back-to-back monthly drops. The index is up 11.7% year-to-date and is higher by 19.9% from its closing low last year.

September 22, 2023 - September 29, 2023
The Look Ahead
The first week of a new month means a bevy of important data. Following a final September read on US Manufacturing PMI from S&P Global, August Construction Spending figures, and September ISM Manufacturing gauge on Monday, jobs numbers take center stage.
JOLTS data, which has a history of moving markets, hits Tuesday during the trading day as vehicle sales reports trickle in for last month. ADP’s Private Payrolls comes Wednesday before the bell along with September Services PMI (final look). ISM Services for September comes later that morning.
Jobless claims have been particularly low lately, indicating a healthy labor market, but we’ll get the full story of September’s employment situation Friday morning – economists expect 170,000 jobs created with the unemployment rate having ticked lower to 3.7% last month.
It’s a light earnings week. Tilray (TLRY) may light up the Cannabis space while staples such as Cal-Maine Foods (CALM), Lamb Weston (LW), Constellation Brands (STZ), and Conagra (CAG) offer quarterly results.
It will be a heavy week, however, for Fed Speak. After Powell, Williams, and Mester speak on Monday, Bostic will comment on the inflation and the economic outlook Tuesday in the pre-market. Bowman and Goolsbee present at conferences Wednesday. Mester’s message at the Chicago Payments Symposium could be particularly market-moving Thursday before the bell.
Crisis Averted?
Over the weekend, the Senate passed a 45-day funding bill to keep the federal government operating. Many sellside strategists expected a shutdown to kick off October, which may have resulted in some market volatility had it played out that way. History shows, however, that stalemates on Capitol Hill do not often lead to significant stock market declines – if anything, returns are strong in the months after the onset of a shutdown. It’s all a moot point now after President Biden signed the stopgap bill.
A Tale of Two 2023s
Investors can now turn their attention to a slew of economic data this week and the hope for a better fourth quarter to come. Looking back, both stocks and bonds performed well from January through July, with a broad index of domestic equities higher by about 20% and the aggregate bond index having sported a total return just shy of 2%. August and September then lived up to their bearish billing.
The final two months of the sometimes-volatile Q3 turned in losses for equities and fixed income. The total US market gave back nearly 7% while sharply rising interest rates led to a more than 3% total return loss on the aggregate bond index.
Is Part III About to Begin?
All eyes now turn to Q4. Bullish seasonality is often bantered about this time of year, but we aren’t out of the woods yet. Since 1950, the SPX tends to indeed rally during parts of October, but volatility has historically emerged over the back half of the month before true seasonal cheer takes hold. Still, BofA put together some research and concluded that when the S&P 500 is positive for the year through the end of September in Year 3 of a Presidential Election Cycle, Q4 averages a gain of 3.2% with a 67% positivity rate. October through December returns after a down September can be even better, history shows.
Get Your Wish List Ready? Bullish Presidential Election Cycle Trends in Q4 of Year 3
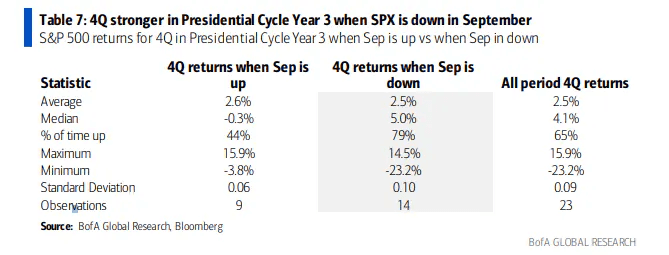
Source: BofA Global Research
A Garden-Variety Correction
Whichever way you slice and dice it, the current correction has the hallmarks of a pullback that should be pounced on. Seasonal tailwinds can turn gusty, though it may take bouts of October volatility to mark a decent low. With one macro risk out of the way (the big-bad government shutdown), investors can shift their eyes back to ongoing labor disputes, the upcoming earnings season, and the November 1 Fed meeting (for which there is just an 18% chance of a hike).
Car Stocks Idle in September, Looking Beyond the Big 3
So, how are things shaping up? The Big Three automakers and the United Auto Workers (UAW) continue their negotiations as additional targeted worker strikes take place. Drama between the two sides was a talking point for many GOP hopefuls in last week’s second Republican primary debate, but where that has been little excitement has been in the share prices of Ford (F), General Motors (GM), and Stellantis (STLA). In September, those three Consumer Discretionary stocks were roughly unchanged. Macro clues were found elsewhere in the industry – Toyota Motors (TM), popular with my fellow penny-pinchers, was up 4.4% last month while the luxury automaker Mercedes Benz (MBGYY) fell 5%.
Consumers Running on Fumes into Year-End?
The story could be that households may finally be tapping the brakes on spending. Barclays reported that real-time card spending took a big hit in September on a 4-week moving average basis. BofA’s internal card trends echoed data charted by Barclays – total card spending per household was 0.3% lower compared to the same week a year ago while retail ex-auto spending was down a significant 1.1%.
Most indicators show that the back-to-school shopping season earned a high grade, but worries are on the rise that an easing labor market and ongoing above-trend inflation may finally cause Americans to tighten their purse strings.
Is the Consumer Finally Backing Off? Card Spending Turns Weaker.
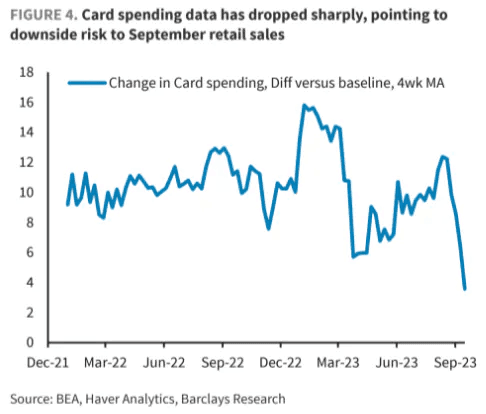
Source: Barclays
Fewer Presents Under the Tree?
The National Retail Federation expects total holiday-related retail sales to grow between 4% and 6% this year. That would be a deceleration from the nosebleed 14.4% spending rate in 2021 and a still-strong 7% last year. The economy continues to moderate following the period of massive stimulus and excess savings that had built up during the throes of the pandemic.
Holiday Spending Expected to Slow from Previous Years' Stellar Growth Rates
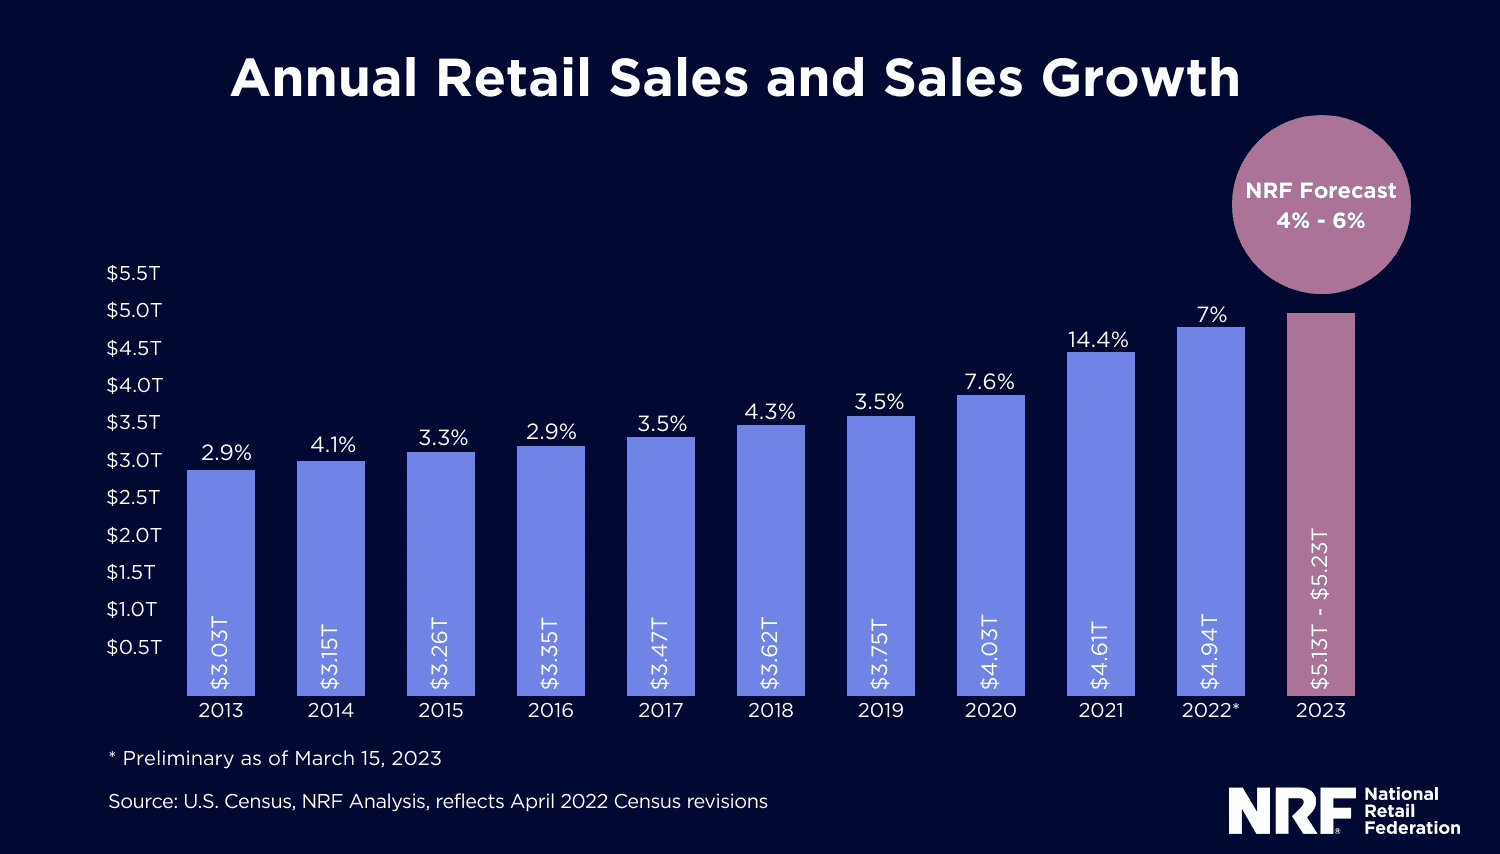
Source: National Retail Federation
As Income Goes, So Goes Spending
Sticking with the consumer theme, key personal income and spending data for August was issued last week. The Bureau of Economic Analysis reported that real spending grew 0.4% in August while incomes rose at the same pace. The Personal Saving Rate fell to 3.9% - a third straight month of declines. The same report showed that the Fed’s preferred inflation gauge, Core PCE, finally dipped back under 4%, the lowest since May 2021 and 1.5 percentage points below the Fed Funds rate.
What’s the story here? It’s still hard to decipher. While some spending data asserts that folks are turning more cautious, official figures point to a consumer that remains somewhat aggressive. We may find out more once companies begin issuing third-quarter results. The big banks will kick things off mid-month (on Friday the 13th, no less) and no shutdown means we will keep on getting the usual government reports that will help the Fed determine its interest rate decision four weeks from now. Softer spending would no doubt result in weaker real GDP growth, but that is just what the Fed wants to see play out.
Staunchly in the “Good News is Bad News” Phase
Something I keep track of is the Citigroup Economic Surprise Index. UBS put out a note last week illustrating the 1-month rolling correlation between the index and stocks. Notice in the chart below that the correlation is just about at the most negative level it has been since late last year. It’s the “good news is bad news” environment (and vice-versa). So, if we see more real-time clues of a slowdown in spending, expect stocks and bonds to react well. Chair Powell and the rest of the FOMC would then be likely to continue to hold the Fed Funds target rate where it is.
Stocks Moving Inverse to Economic Data Surprises

Source: UBS
Sentiment Sours as the Summer Ends
We got fresh reads on soft data, too. The Conference Board’s Consumer Confidence Survey fell further off its July high. The September figure of 103 was down from an upwardly revised 108.7 in the previous month. Digging into the report, the Present Situation Index increased but the Expectations Index was quite weak at 73.7 - readings below 80, the Conference Board says, often signal a recession within a year. Earlier in September, the Leading Economic Index (LEI), also put out by the Conference Board, revealed a 17th contraction – a streak only seen in 1973 and 2007, two severe recessions.
Fears of Recession Weigh on Consumer Sentiment
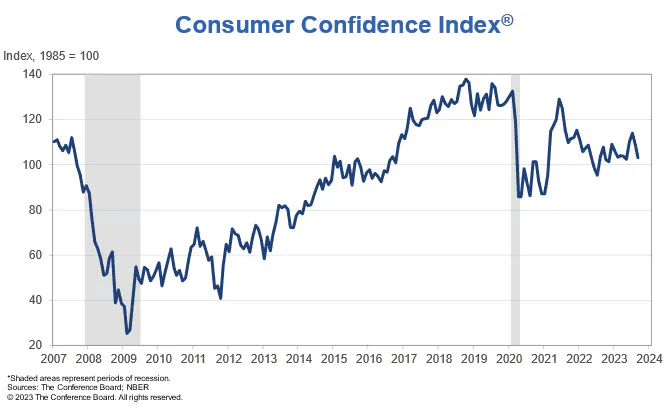
Source: The Conference Board
Big Picture: Fed Still Seen Piloting a Soft Landing
A successful easing of inflation without the Fed inflicting a recession remains the consensus. US Q3 real GDP growth is expected to be in the 3% to 4% range, according to real-time betting markets, while the Wall Street consensus is softer near 2%. Investors should take the widely reported Atlanta Fed GDPnow tool with caution – as major economic updates come out this week and next, I expect the model to bring down its Q3 growth rate output, which is currently just under 5%. Meanwhile, the pace of economic expansion might trough this quarter or next, but growth is seen as approaching 0%, but not turning negative, in early 2024.
A Soft Landing Is Still Very Much In Play

Source: Goldman Sachs
The Dynamic Trio: Dollar, Rates, Oil
Price action at the macro level will be key to watch. The US dollar is up a stunning 11 consecutive weeks, having nearly completed a perfect third quarter. The higher the greenback climbs, the more near-term multinational corporations’ earnings are pressured. Equities have also tended to move nearly inverse the dollar, so any retreat should help the SPX begin its Q4 ascent.
The Treasury market is also a focus of traders – the 20-year bond yield touched 5% last Thursday morning as rates across the curve notched fresh cycle highs. Not only do higher hurdle rates make capital allocation decisions all the more difficult in the C-Suite, but lofty discount rates also imply lower stock prices. Investors, meanwhile, have plenty of options with their cash and fixed-income allocation.
Along with the dollar and yields, higher energy prices were a major theme last quarter. It seems like ages ago, but it was just in June when WTI was comfortably under $70, and anything AI-related was the hot trade. Jump ahead, and it has been the Energy sector boasting big gains as oil steadies around $90. The XLE ETF was like a well-oiled machine in the third quarter, up 13%, with all other sectors, save Communication Services, finishing in the red.
Q3 Sector Performances: Energy Jumps, Defensives Weak
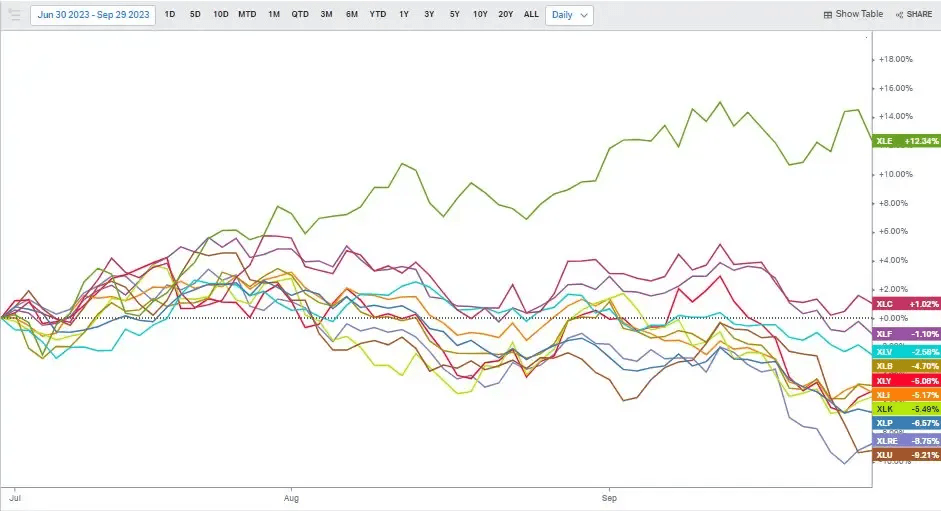
Source: Koyfin Charts
The Bottom Line
After much hoopla, the government remains open to start October. Our focus remains on macro markets and what key indicators and trends mean for investors. September employment data comes this week and the Q3 earnings season begins on Friday the 13th with JP Morgan. The bulls hope strong seasonality takes hold while the bears hope to scare investors for a third straight month.
Want access to your own expert-managed investment portfolio? Download Allio in the app store today!
Related Articles


The articles and customer support materials available on this property by Allio are educational only and not investment or tax advice.
If not otherwise specified above, this page contains original content by Allio Advisors LLC. This content is for general informational purposes only.
The information provided should be used at your own risk.
The original content provided here by Allio should not be construed as personal financial planning, tax, or financial advice. Whether an article, FAQ, customer support collateral, or interactive calculator, all original content by Allio is only for general informational purposes.
While we do our utmost to present fair, accurate reporting and analysis, Allio offers no warranties about the accuracy or completeness of the information contained in the published articles. Please pay attention to the original publication date and last updated date of each article. Allio offers no guarantee that it will update its articles after the date they were posted with subsequent developments of any kind, including, but not limited to, any subsequent changes in the relevant laws and regulations.
Any links provided to other websites are offered as a matter of convenience and are not intended to imply that Allio or its writers endorse, sponsor, promote, and/or are affiliated with the owners of or participants in those sites, or endorses any information contained on those sites, unless expressly stated otherwise.
Allio may publish content that has been created by affiliated or unaffiliated contributors, who may include employees, other financial advisors, third-party authors who are paid a fee by Allio, or other parties. Unless otherwise noted, the content of such posts does not necessarily represent the actual views or opinions of Allio or any of its officers, directors, or employees. The opinions expressed by guest writers and/or article sources/interviewees are strictly their own and do not necessarily represent those of Allio.
For content involving investments or securities, you should know that investing in securities involves risks, and there is always the potential of losing money when you invest in securities. Before investing, consider your investment objectives and Allio's charges and expenses. Past performance does not guarantee future results, and the likelihood of investment outcomes are hypothetical in nature. This page is not an offer, solicitation of an offer, or advice to buy or sell securities in jurisdictions where Allio Advisors is not registered.
For content related to taxes, you should know that you should not rely on the information as tax advice. Articles or FAQs do not constitute a tax opinion and are not intended or written to be used, nor can they be used, by any taxpayer for the purpose of avoiding penalties that may be imposed on the taxpayer.