Updated November 27, 2023

Mike Zaccardi, CFA, CMT
Macro Money Monitor
Market Recap
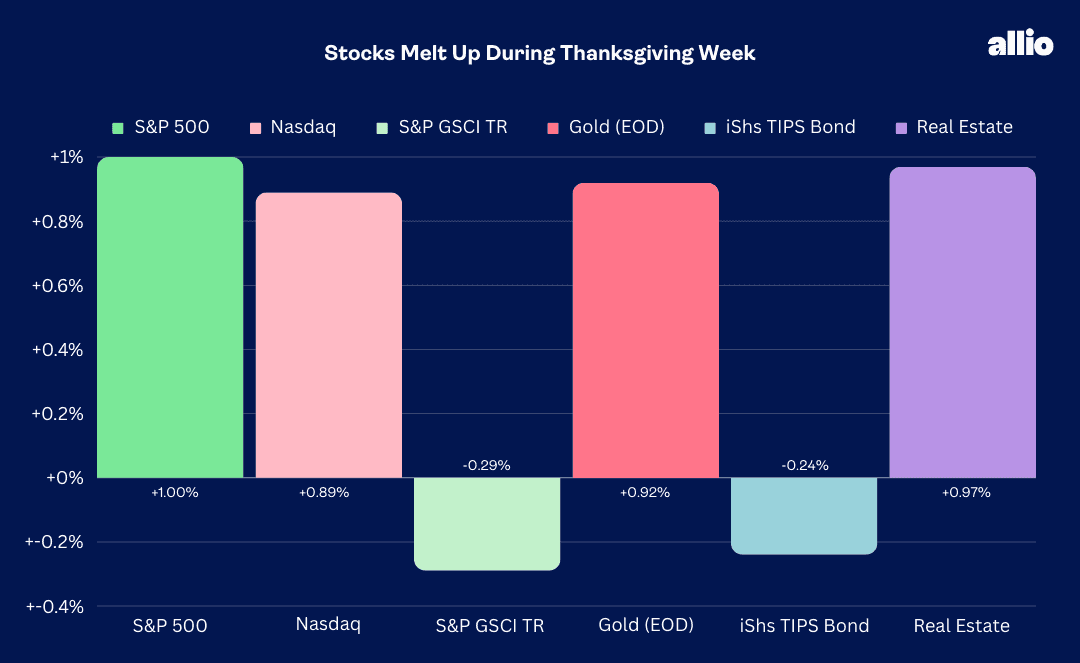
Stocks were higher for a fourth straight week, highlighted by the S&P 500’s 1% advance. The SPX is now up 8.5% month to date, pacing for the 4th best November since 1957. Often overlooked, large-cap value and mid-caps modestly outperformed last week while the Nasdaq Composite notched another fresh YTD weekly closing high, climbing 0.9% during the holiday-shortened period.
Sector-wise, it was the Healthcare space posting the strongest return, up 2.3%, but all 11 S&P 500 sectors finished in the black. Interest rates crept up, causing a tick lower in the TIPS ETF, but it was among the quietest weeks we have seen lately in the fixed-income market. Real Estate rose on par with the SPX as a result.
Gold finally settled above $2000 per ounce for a week – the first time since early May despite the modest uptick in yields. The US Dollar Index’s second consecutive weekly decline was indeed a tailwind for precious metals, but it didn’t seem to help the commodities market very much. The Goldman Sachs Commodity Index dipped and is now lower for five weeks running; consumers undoubtedly welcome the fall in oil and gas prices.
For the year, the S&P 500 is up 18.8% and the Nasdaq is higher by 36.2%.
November 17, 2023 - November 24, 2023
The Look Ahead
Traders face a busy week on the macro data front. Monday is light with just New Home Sales due out at 10 a.m. ET. We’ve seen mixed trends in real estate given the drop in mortgage rates from 8% to under 7.5%, but the October Existing Home Sales figure was worse than expected last week, and a fresh 13-year low. Following a dreadful Homebuilder Sentiment also reported before the holiday, the September Case-Shiller Home Price Index hits Tuesday in the pre-market before a November read on the Conference Board’s Consumer Confidence Index.
The data flow picks up on Wednesday with a second look at third-quarter GDP followed by the release of the Fed’s Beige Book of regional economic activity. Jobless Claims return to their usual Thursday morning slot after last Wednesday’s rather sanguine view on initial and continuing claims. Also moving markets at 8:30 a.m. ET Thursday will be PCE inflation for October as well as Personal Income & Spending data for last month. Chicago PMI and Pending Home Sales come during the trading day on Thursday.
The week wraps up with a final update on S&P Global Manufacturing PMI, Construction Spending for October, the all-important ISM Manufacturing survey for November, and Chair Powell’s Fireside Chat at Spelman College in Atlanta.
This Week's Data Deck: The Focus Will Be On Personal Income & Outlays, PCE, GDP 3Q (Second Look), ISM Manufacturing, and Housing Data
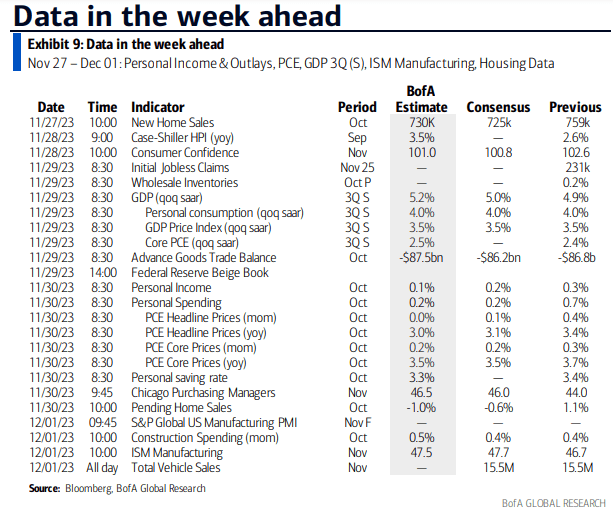
Source: BofA Global Research
Earnings Reports This Week
Earnings season is unofficially over, but we will continue to hear from companies across sectors – CEO commentary on the state of the global economy and the latest consumer trends as the holiday shopping season kicks into high gear will be key. CrowdStrike (CRWD) is one of the standouts, and Zscaler (ZS) will also offer a look at the state of cybersecurity and corporate investment trends early this week.
Snowflake (SNOW) and Dow-component Salesforce (CRM) might also shake up the tech sector Wednesday evening before eyes shift back to the consumer with a Q3 report from the nation’s largest standalone grocery chain, Kroger (KR), on Thursday. Ulta Beauty (ULTA) has endured a tough last six months – the specialty retailer reports Thursday AMC. Marvell (MRVL) numbers also hit the tape Thursday after the bell.
CrowdStrike, Snowflake, Salesforce, Kroger, Marvell, Ulta Beauty Are the Earnings Headliners
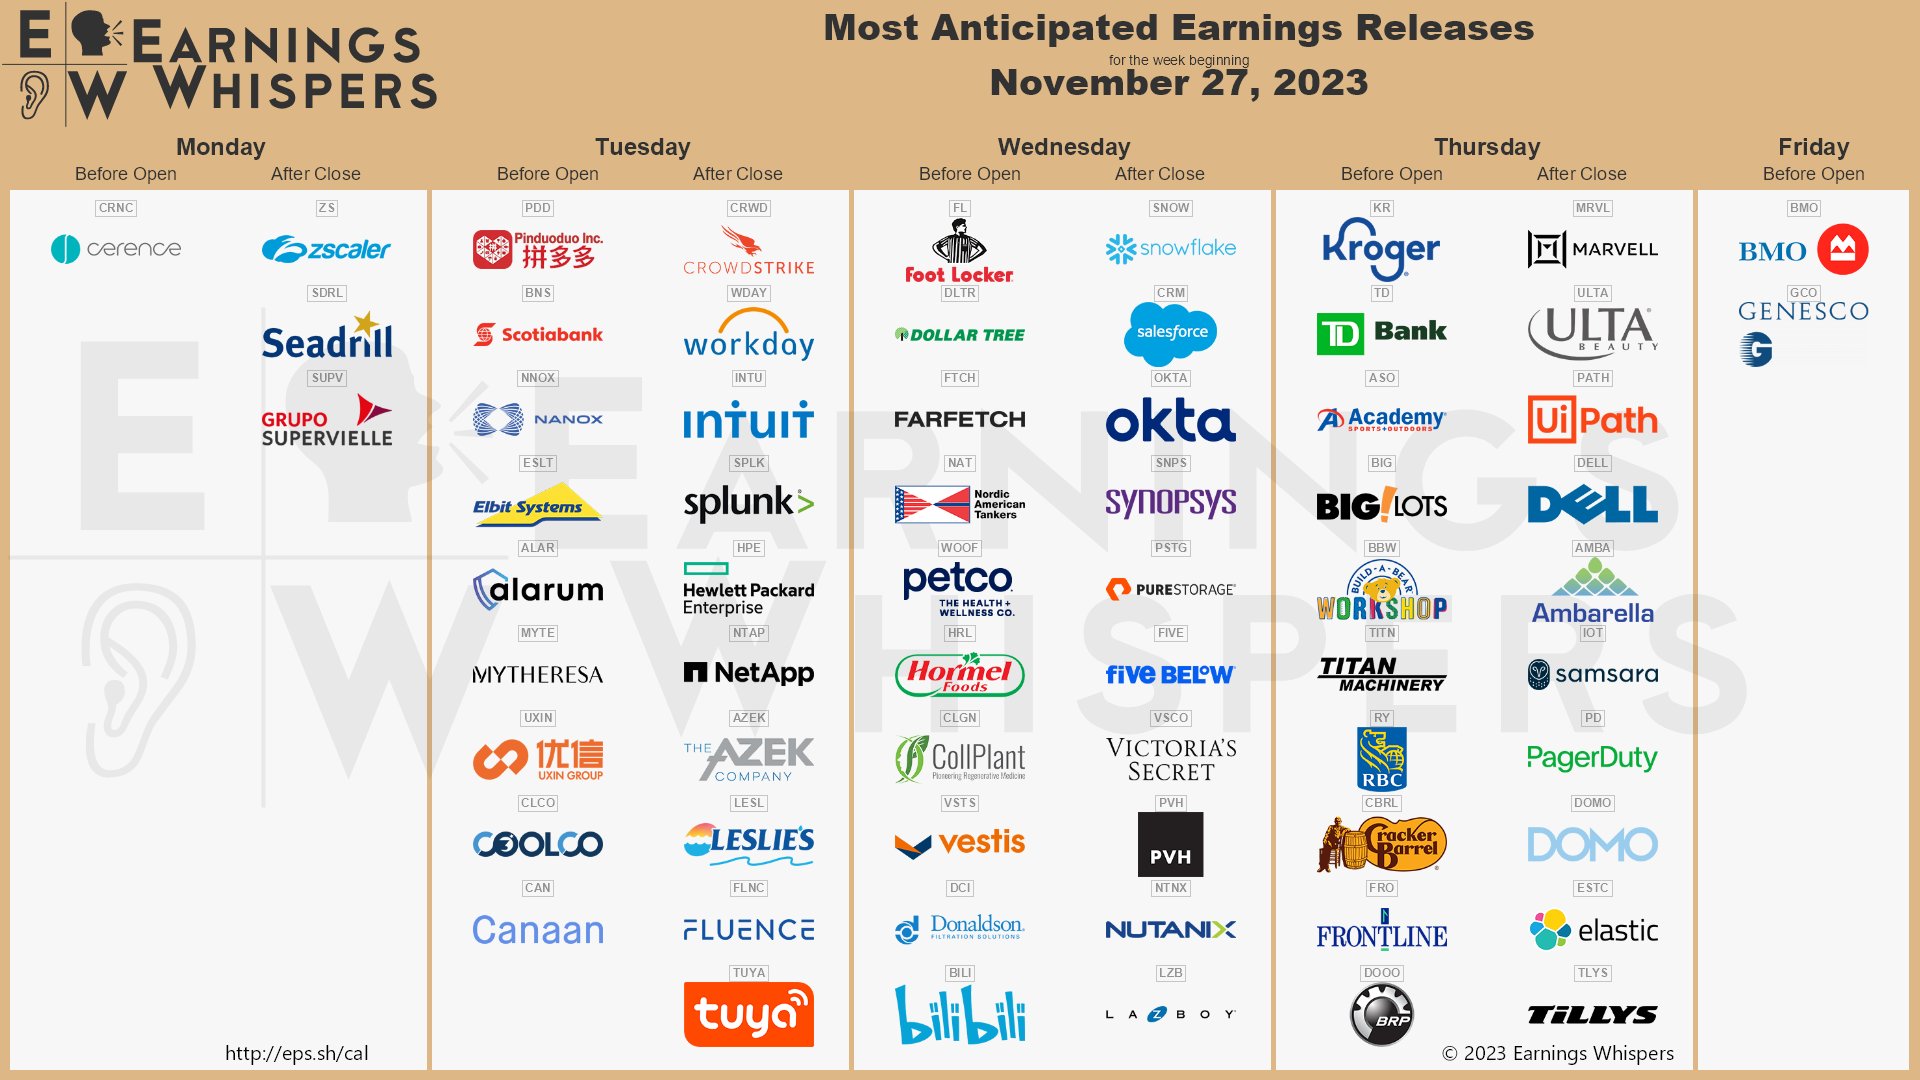
Source: Earnings Whispers
Topic of the Week: Investors Upbeat, Wall Street Pros Downbeat
The November through early January stretch is often a jolly time of year for investors. What makes 2023 special is that seasonality has worked to a tee over the past handful of quarters. Both this year and last, the S&P 500 notched a rebound high in August only to sell off through September (the worst month, on average) and then bottom in October. Is history repeating itself? Has Santa Claus come early on Wall Street? It has that feeling.
We track investor sentiment and positioning trends, and one theme we cannot help but find common across gauges is a pickup in optimism. Let’s roll through some of the preferred measures of investor sentiment, then put it in the right macro context as year-end nears.
First, each Thursday the American Association of Individual Investors (AAII) publishes its bull/bear survey. Last week’s update, released the day before Thanksgiving, revealed a fresh three-month high in net bulls. Notice in the graph below that the bull count ticked up each of the last three weeks after hitting a trough of –26 (bulls minus bears) – just as the S&P 500 has rallied back to near its 2023 highs. Funny how that works.
The key thing for investors to remember about sentiment data is that they are often considered correct most of the time. While the old contrarian adage says to do the opposite of the herd, the majority is usually right – it is only at extremes in euphoria and despondency when taking an aggressive bet in the opposite investor-sentiment direction usually pays off.
Regardless, the latest AAII data clearly point to a tone shift among the retail investor crowd compared to the pessimistic collective voice that clamored in mid and late October. Thus, it makes sense that the last two weeks have featured the biggest inflow into stocks since February 2022, according to EPFR flow data.
AAII Sentiment Survey: The Bullish Pack Grows in November

Source: AAII
Active Investment Managers Stepping Out on the Risk Spectrum
Also published last Wednesday was the weekly survey from the National Association of Active Investment Managers (NAAIM). The graph below shows the reported average exposure to US stocks as reported by the group's members. Just shy of 80, it’s the most aggressive allocation since early August. Recall that late July marked the year-to-date peak in stocks. Stock-pickers were most downbeat about markets in late September and early October last year – which turned out to be a solid buying opportunity heading into the home stretch of 2022.
AI euphoria, hopes for a soft landing, and somewhat benign interest rate movements in July, along with higher stock prices of course, were all principal factors contributing to a multi-year peak in the NAAIM Number. Could we approach 100 on the scale before the calendar flips to 2024? A melt-up rally, soft inflation prints, and not-too-hot, not-too-cold jobs numbers could get us there. This week’s PCE data, an inflation barometer closely monitored by the Fed, and Personal Income and Spending figures will certainly impact the feelings among active managers.
Fear & Greed
Maybe the most well-known sentiment pulse check that has come about in recent years is the CNN Fear & Greed Index. This is not a survey, though. The collection of data includes seven indicators that are thought to measure market behavior. CNN uses a momentum factor (how far the S&P 500 is stretched from its 125-day moving average), the number of new highs and lows on the NYSE and breadth, activity in the options market, corporate bond interest rate spreads, equity market volatility, and the appetite for stocks compared to bonds.
Settling at 68 out of 100 last week, the indicator pointer is positioned in “greed” territory. It’s also the highest mark since early August – much like the NAAIM Number. Helping to drive the Fear & Greed Index higher lately has simply been price strength in the S&P 500. The index is 160 points above its 125-day moving average, the most stretched bullish since Q3, while the number of net new 52-week highs and lows on the NYSE has climbed above zero for the first time in three months (which flashes a “Greed” warning).
I won’t get into all seven, but it’s important to point out that the CBOE Volatility Index (VIX) closed last week under 13 for the softest reading since January 2020. Options traders see relatively light day-to-day swings in the S&P 500 looking ahead 30 days.
CNN Fear & Greed Index: Yet Another Sign of Risk Appetite
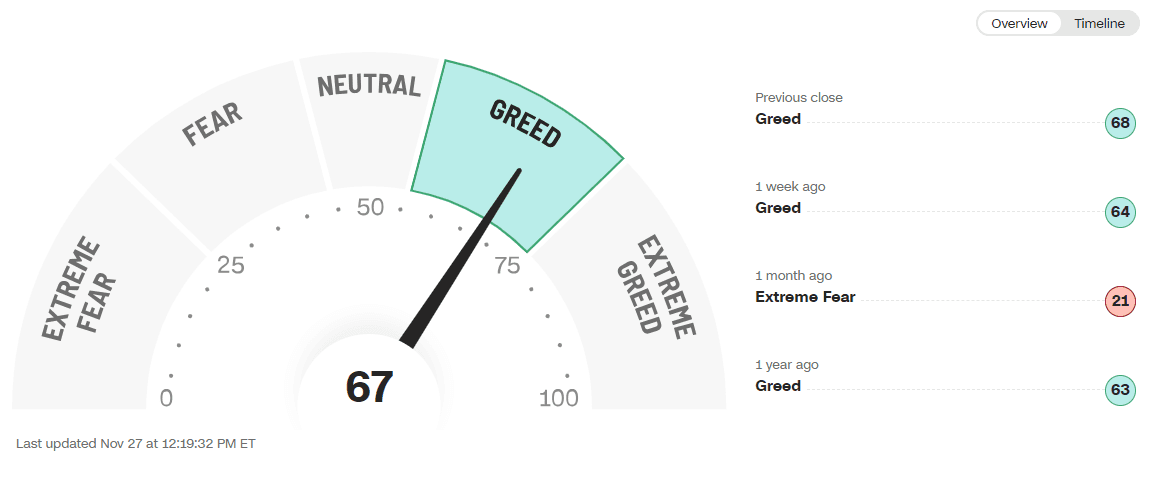
Source: CNN
Bank of America’s Monthly Global Fund Manager Survey (FMS): Getting Long
A final view on how investors feel about stocks is via a survey conducted each month by BofA. What is often overlooked with the FMS is that it’s not actual positioning data – it is simply survey response results. So, according to the November report, global portfolio managers are purportedly overweight stocks for the first time in 18 months. The hopeful crossover comes after a protracted stretch of bearishness, the length of which had never been seen in the survey’s 23-year history. Not even the 2007-2009 bear market featured such an extended duration of managers claiming to be underweight stocks.
What makes this time a bit different is that there are plenty of alternatives. Coined the “TARA” trade (there are reasonable alternatives) by Goldman Sachs in Q3 last year, ending the so-called “TINA” trade (there is no alternative to stocks), short-term Treasury bills offer rates north of 5% and TIPS yields are still healthy above 2% across the curve, though off their October highs. Back in 2009, by contrast, the Fed’s zero interest-rate policy had begun, meaning large portfolio managers had little choice but to go with stocks if they sought any kind of decent return. In that context, it’s all the more interesting to see an aggressive bullish turn in the FMS today.
Portfolio Managers Claim to be Overweight Stocks Following a Deeply Bearish Stretch

Source: BofA Global Research
Your Move, Sellside
All these touchy-feely sentiment data are interesting, but what does it have to do with the macro landscape? It all feeds into how Wall Street’s best and brightest see 2024 shaping up. Last year, perhaps the best contrarian macro indicator of them all was simply to go against the consensus professional view on the S&P 500’s 2023 return.
A year ago, Bloomberg reported that the average projected change in the S&P 500 for 2023 by bank forecasters was negative. That had not happened since at least 1999, setting the bar oh so low starting this past January. Normally when you turn on financial TV or catch up on weekend reading in major money publications this time of year, you’ll hear the usual sellside refrain: “We expect stocks to return 8% to 10% next year.” That was not the case 12 months ago. What has happened so far? Scroll back up – the S&P 500 is up 18.8% year to date.
But what about the outlook for this coming year? With many S&P 500 price forecasts for year-end ‘24 hot off the presses, it turns out that they are dour again. Reuters reports that a poll of 33 strategists finds that the median year-end 2024 SPX target is just 4700, only 3% above last Friday’s close. Toss in dividends, and we are talking about a total return expectation of less than 5% (below the yield on money markets and high-quality US corporate bonds).
This broad disconnect between investors and strategists may present opportunities over the coming weeks. What’s more, meaningfully differentiated views among active stock-pickers today, as seen in a surge of aggressive positioning among active investment managers per the NAAIM Equity Exposure reading and BofA’s survey which suggests a more cautious, albeit positive, stance, means there could be some added jostling for year-end positions. Our team will monitor trends to pounce on such opportunities using proper risk management techniques.
The Bottom Line
There is no sure thing when it comes to investing. Assessing the macro situation should always include collecting relevant pieces of information, and then forming a risk-weighted outlook. Today, there is a clear disconnect between active investor sentiment and where the professionals see stocks going. That will make the final handful of weeks of 2023 even more critical as to how 2024 unfolds.
Want access to your own expert-managed investment portfolio? Download Allio in the app store today!
Related Articles


The articles and customer support materials available on this property by Allio are educational only and not investment or tax advice.
If not otherwise specified above, this page contains original content by Allio Advisors LLC. This content is for general informational purposes only.
The information provided should be used at your own risk.
The original content provided here by Allio should not be construed as personal financial planning, tax, or financial advice. Whether an article, FAQ, customer support collateral, or interactive calculator, all original content by Allio is only for general informational purposes.
While we do our utmost to present fair, accurate reporting and analysis, Allio offers no warranties about the accuracy or completeness of the information contained in the published articles. Please pay attention to the original publication date and last updated date of each article. Allio offers no guarantee that it will update its articles after the date they were posted with subsequent developments of any kind, including, but not limited to, any subsequent changes in the relevant laws and regulations.
Any links provided to other websites are offered as a matter of convenience and are not intended to imply that Allio or its writers endorse, sponsor, promote, and/or are affiliated with the owners of or participants in those sites, or endorses any information contained on those sites, unless expressly stated otherwise.
Allio may publish content that has been created by affiliated or unaffiliated contributors, who may include employees, other financial advisors, third-party authors who are paid a fee by Allio, or other parties. Unless otherwise noted, the content of such posts does not necessarily represent the actual views or opinions of Allio or any of its officers, directors, or employees. The opinions expressed by guest writers and/or article sources/interviewees are strictly their own and do not necessarily represent those of Allio.
For content involving investments or securities, you should know that investing in securities involves risks, and there is always the potential of losing money when you invest in securities. Before investing, consider your investment objectives and Allio's charges and expenses. Past performance does not guarantee future results, and the likelihood of investment outcomes are hypothetical in nature. This page is not an offer, solicitation of an offer, or advice to buy or sell securities in jurisdictions where Allio Advisors is not registered.
For content related to taxes, you should know that you should not rely on the information as tax advice. Articles or FAQs do not constitute a tax opinion and are not intended or written to be used, nor can they be used, by any taxpayer for the purpose of avoiding penalties that may be imposed on the taxpayer.