Updated May 23, 2023

Raymond Micaletti, Ph.D.
Macro Money Monitor
Market Recap
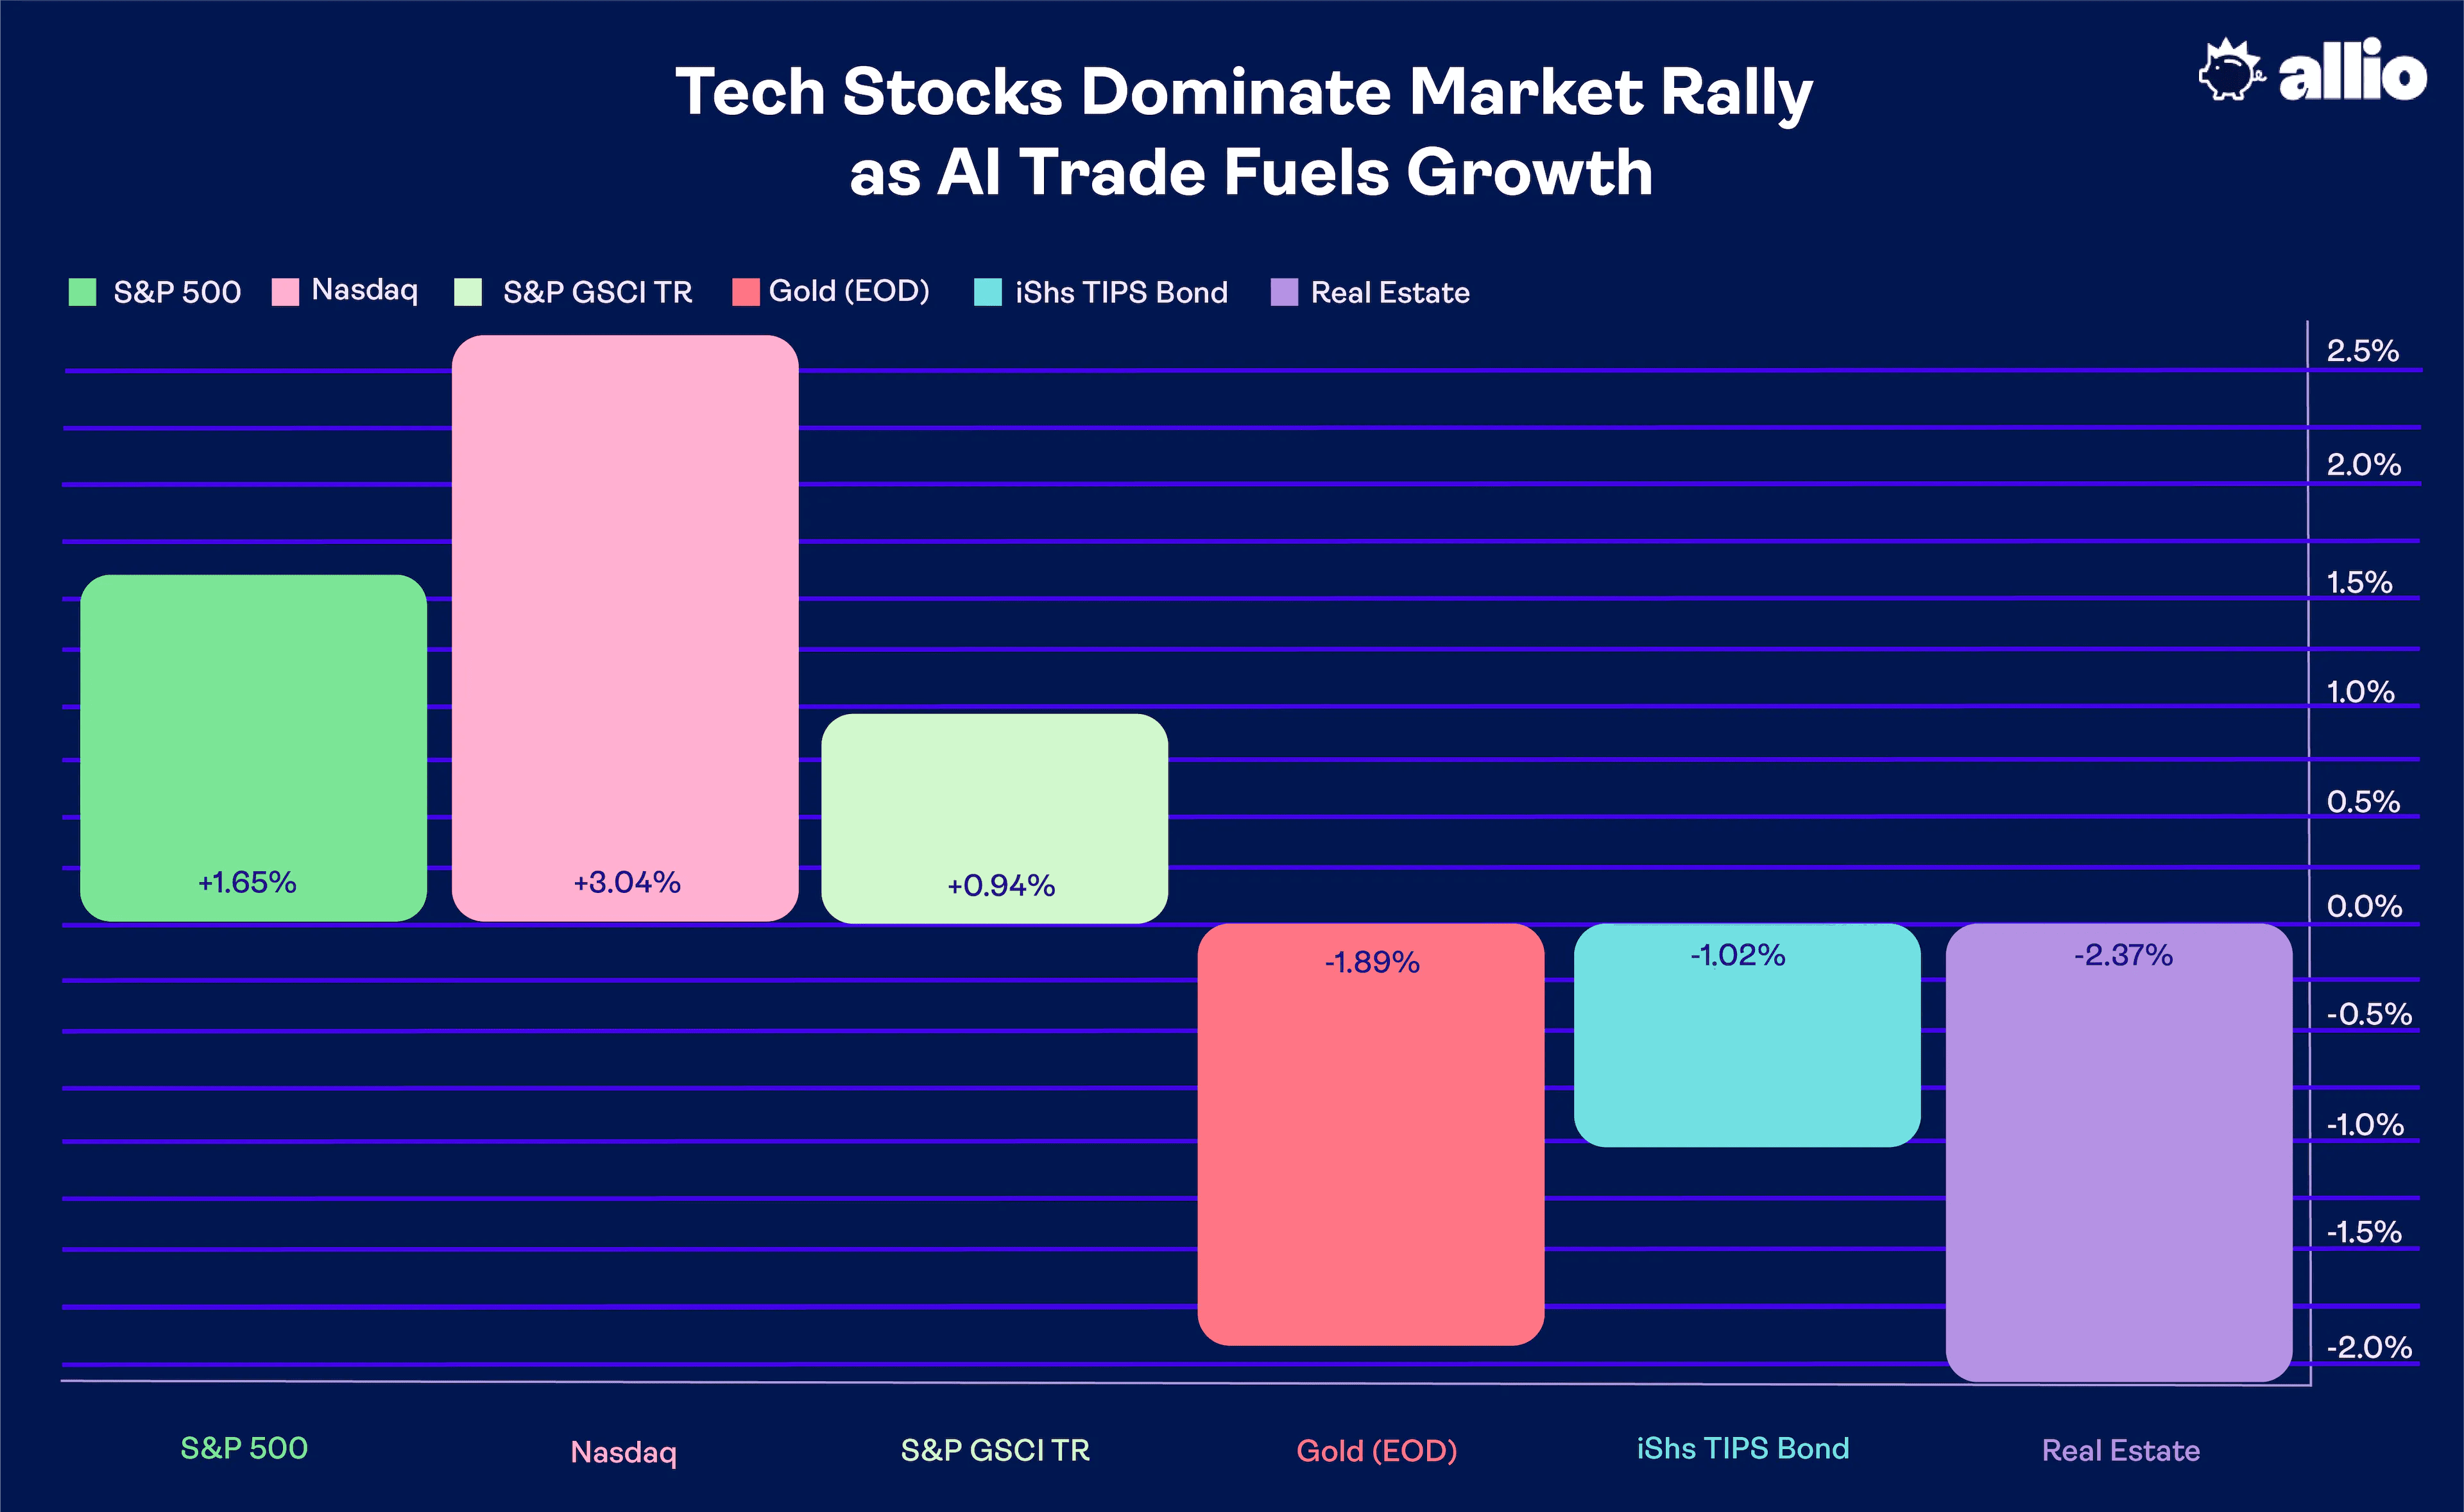
Stocks edged higher last week on the heels of more leadership from mega-cap growth. The S&P 500 rose 1.7% while the NASDAQ Composite jumped better than 3%. The Information Technology sector led the way with a 4.3% advance; Communication Services and Consumer Discretionary also outperformed while defensive sectors such as Utilities, Consumer Staples, and Health Care lagged. Small caps actually bested the SPX with a 2% rally. The Real Estate sector was again hit hard, falling 2.4% as interest rates marched higher amid decent economic data.
Dates: 5/12/23 - 5/19/23
On the commodities front, a 3% rise in oil prices helped the broad commodities basket weave a gain of less than 1%. Gold, however, tumbled 2% for its second straight week of losses. A stronger dollar and rising interest rates did not help precious metals last week. The TIPS market struggled, giving back a percentage point on the TIP ETF as inflation expectations ebbed with more uncertainty regarding an additional Federal Reserve rate hike.
Let’s Get It (AI) On!
Are there any UFC fans out there? The iconic catchphrase to light the match in wrestling main events is sort of what the Artificial Intelligence (AI) trade feels like right now. The macro implications are many. Consider just how fast platforms like ChatGPT and Bard have infiltrated our way of life. For now, the consensus opinion is that the mega-cap tech companies stand to benefit the most as they scale AI and potentially reduce headcounts further.
It’s Tech’s World, And We’re Just Living in It
The proof is in the returns. Thus far in 2023, the top five contributors to the SPX’s 9% rally account for 80% of the total performance. That leaves a wide gap between how the growth style has fared compared to value. We’ve talked about how investors were positioned lightly in the tech trade coming into this year and how the consensus generally called for value to keep working this year. As is so often the case, equities zigged right as most were expecting them to zag.
Extreme Concentration of Returns So Far In 2023
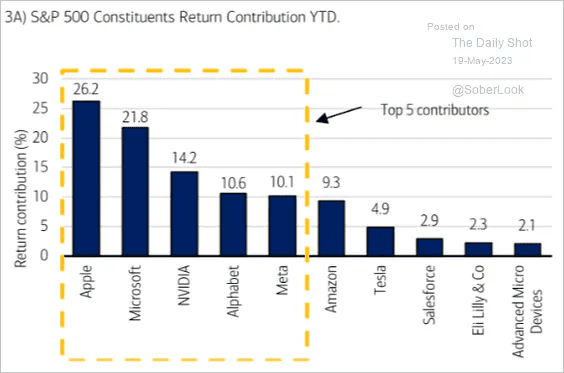
Source: Merrill Lynch, Sober Look
The Growth > Value Mantra Reigns Supreme
The tech-heavy growth style has returned 23% year-to-date while value’s total return is –1% (using index ETFs as proxies). That is among the widest annual spreads the market has ever witnessed. Still, on the 2-year view, both styles are up just fractionally with dividends included.
Zoom out to three years, and value is actually outperforming growth. That’s evidence of the current trading environment favoring active management – being able to spot the macro clues of key trend inflections that lead to one style producing alpha versus another. From there, strategists can dig into what sectors may soon be in vogue. So-called “sector rotation” is a hallmark of how equities as a whole behave.
The Growth Rally Marches On As Value Sputters

Source: Stockcharts.com
Higher Dollar, Higher Rates? No Problem
Focusing on last week’s price action and the breadcrumbs it might be leaving for us, we noted that the tech-trade was in full bloom. And that has been the case as springtime ushers in (for us in the northern hemisphere). Economically resistant sectors, known as the defensives, were weak. That intermarket price action came as the US dollar climbed and interest rates ticked up. Thus, equities featured a “growth-on” mindset. Fears of a recession were once again put off for another day while the Fed Funds futures market turned increasingly bullish about another Fed rate hike when the FOMC gathers again in the middle of next month.
Powell’s Dovish Comments Lower Rate Hike Odds
By early Friday, traders had priced in a 40% probability of another quarter-point rate increase. Fed Chief Powell then spoke Friday morning with prepared remarks (indicating this was not simply an off-the-cuff message) that were interpreted as dovish by bond traders. While Treasury yields remained higher for the week, odds of an 11th consecutive policy rate rise ticked back down to less than 1-in-5.
But how’s this for perspective on the macro uncertainty- from the March low, the 1-year Treasury yield is now up a full percentage point. You can think of the 1-year rate as an average of the Fed’s benchmark rate going out the next 12 months. Traders still anticipate a pause that will last through October, with the first cut happening on November 1 with gradual easing in 2024.
Key Economic Readings Come Next Week
But all eyes will be on labor market data that hits from May 31 through June 2. A deluge of economic reports that the Fed pays attention to begins with the Job Openings and Labor Turnover Survey (JOLTS) report on Wednesday the 31st. In Powell’s comments last Friday, he underscored the importance of job openings figures, so the April JOLTS reading will be key. That came after the U.S. Leading Economic Index (LEI) printed a recessionary 13th straight negative print earlier a week ago.
On the first day of June comes a barrage of market-moving tells on the state of the economy – ADP private payrolls employment, jobless claims, unit productivity & costs, S&P Global Manufacturing PMI, and ISM Manufacturing are all released that morning before the official May jobs report at 8:30 a.m. Friday. The holiday-shortened week will dictate what the Fed decides on June 14.
Earnings on Tap: Retailers and Nvidia
For now, we might get a light week ahead. While FOMC minutes are released Wednesday afternoon and durable goods numbers cross the wires on Friday, the bulk of earnings season is in the rearview mirror. A few fireworks might come out of the embattled retail niche mid-week. Lowe’s, AutoZone, BJ’s Wholesale, Dick’s Sporting Goods, Toll Brothers, and Urban Outfitters all issue Q1 results Tuesday. Other retailers’ report this week, but (getting back to the AI-trade) NVIDIA’s quarterly numbers hit the tape Wednesday afternoon.
Earnings Season Winding Down

Source: Wall Street Horizon
AI Clues From Nvidia – The Macro Impact
NVDA is top of the pack this year – up 114% for the pole position among S&P 500 leaders in 2023. Will the chipmaker rev its engines once more after earnings Wednesday evening, or will semi stocks spin into the wall? Let’s take a brief pit stop from the macro-outlook to check out what’s now the world’s 5th biggest company by market cap.
Analysts expect $0.92 of per-share profits, down from $1.36 of operating earnings in the same quarter last year. Options traders, meanwhile, expect a 6.4% move in the stock based on current options pricing. NVDA is the company to watch this week for clues on where the global macro stands heading into the summer months.
The Technical Take: Nasdaq 100 Breaks Above Its August 2022 Peak
Our team will be monitoring how the S&P 500 handles that report. Price action suggests that the tone on Wall Street is shifting from bearish to bullish. The Nasdaq 100 ETF (QQQ) pierced through key resistance last week, and an upbeat report from NVIDIA could help continue that trend in advance of key economic indicators next week.
The “Qs” broke to fresh 13-month highs last Thursday, negating what some technicians pointed out as a bearish rising wedge pattern on the charts. We have been overweight QQQ for more than a month as we expected further AI-driven upside in tech, and that has played out according to plan.
QQQ: Bearish Rising Wedge? The Bulls Say No.
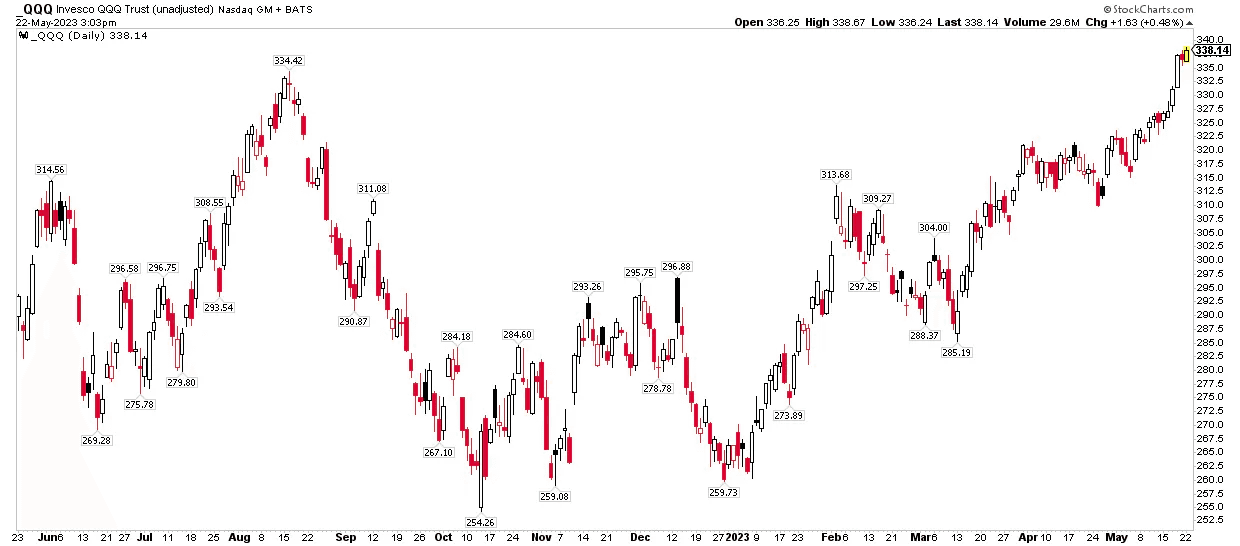
Source: Stockcharts.com
Our in-house technicians note that bearish overhead supply has dried up near 13,200 on Nasdaq 100 futures and within the 4150-4180 zone in S&P 500 futures. This week, while a bit light data-wise, could be especially important for chartists to see if last week’s upside move is confirmed.
A Flat Year for the Average Stock
As large caps vie for a confirmed breakout, small-cap stocks continue to meander. The Russell 2000 ETF (IWM) was higher by 14% on the year through Groundhog Day. Shadows immediately surfaced, and the value-heavy area was negative for 2023 just a handful of weeks later. We can gauge the strength of markets ex-large caps by looking at equal-weight indices, too. While IWM is fractionally positive YTD, the Russell 1000 equal-weight ETF (EQAL) was down modestly this year (through last Friday). Portfolio managers not exposed enough to the biggest of big tech stocks are having a rough year.
This Year’s Theme: Tech Up, Everything Else Just ‘Meh’
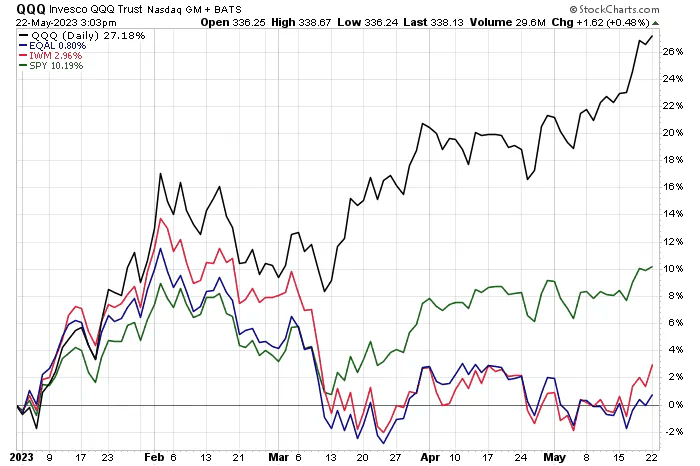
Source: Stockcharts.com
Intermarket Macro Analysis
From an intermarket perspective, the latest tech thrust is all the more impressive considering that interest rates have been on the rise. A year ago, steep climbs in Treasury yields clearly pressured growth stocks as inflation fears were most pronounced. Today, it is a different situation.
Rates are rising for other reasons – the inflation scare is subsiding while a looming recession captures the limelight. So, when economic optimism increases, yields tend to tick up. It’s kind of the “good news is good news” aura versus the “bad news is good news” narrative of previous quarters - as Treasury prices dropped each day last week, stocks did just fine. As for the bears’ call that weak breadth portends an imminent decline in stocks, the data simply does not support that assertion.
For starters, it is a flawed argument since many other stocks have participated in the rally off the lows from 2022. Moreover, how the largest companies have performed in the recent past has little bearing on forward returns, according to market research. What’s more, Wall Street pundits need to widen their view. Go overseas and check out what’s happening. The German DAX and Japan Nikkei 225 are in full-on bull market mode. The DAX just notched an all-time high while the Nikkei 225 climbs to levels not seen in more than 30 years. Lastly, small caps have been keeping pace with large caps in recent weeks, a bit of a stealthy move after severe negative alpha from February through April – something to watch.
“But What if the US Defaults?”
Let’s end with the media’s favorite topic, the debt ceiling debate. Political posturing is ongoing, and an 11th-hour decision may or may not happen. As it stands, short-term Treasury bill rates hover near 5.5%, far above later-dated bills. More broadly, bond market volatility remains near extreme territory.
The ICE BofA MOVE Index, the VIX of the fixed-income world, has not retreated from its triple-digit level. Equity market volatility is indeed muted, though. The VIX settled last week under 17. While we have mentioned before how VIX futures contracts are priced for some heightened stock market risks in the coming months, the debt ceiling issue and potential government default are not seen as extreme risks. While anything could happen, we are looking elsewhere for downside risk catalysts.
The Bottom Line
As we near zero-hour of the D.C.-manufactured debt ceiling issue, stocks are taking it all in stride, and Treasury rates are on the rise. Fears of a recession continue to get pushed out as corporate profits verify better than feared. Within equities, the AI boom is seen in the absolute and relative price action of tech-related megacaps in the Nasdaq 100 while small caps and the value style struggle in 2023. We continue to favor a bullish near-term view but are keenly aware of downside risks as the year progresses.
Want access to your own expert-managed investment portfolio? Download Allio in the app store today!
Related Articles


The articles and customer support materials available on this property by Allio are educational only and not investment or tax advice.
If not otherwise specified above, this page contains original content by Allio Advisors LLC. This content is for general informational purposes only.
The information provided should be used at your own risk.
The original content provided here by Allio should not be construed as personal financial planning, tax, or financial advice. Whether an article, FAQ, customer support collateral, or interactive calculator, all original content by Allio is only for general informational purposes.
While we do our utmost to present fair, accurate reporting and analysis, Allio offers no warranties about the accuracy or completeness of the information contained in the published articles. Please pay attention to the original publication date and last updated date of each article. Allio offers no guarantee that it will update its articles after the date they were posted with subsequent developments of any kind, including, but not limited to, any subsequent changes in the relevant laws and regulations.
Any links provided to other websites are offered as a matter of convenience and are not intended to imply that Allio or its writers endorse, sponsor, promote, and/or are affiliated with the owners of or participants in those sites, or endorses any information contained on those sites, unless expressly stated otherwise.
Allio may publish content that has been created by affiliated or unaffiliated contributors, who may include employees, other financial advisors, third-party authors who are paid a fee by Allio, or other parties. Unless otherwise noted, the content of such posts does not necessarily represent the actual views or opinions of Allio or any of its officers, directors, or employees. The opinions expressed by guest writers and/or article sources/interviewees are strictly their own and do not necessarily represent those of Allio.
For content involving investments or securities, you should know that investing in securities involves risks, and there is always the potential of losing money when you invest in securities. Before investing, consider your investment objectives and Allio's charges and expenses. Past performance does not guarantee future results, and the likelihood of investment outcomes are hypothetical in nature. This page is not an offer, solicitation of an offer, or advice to buy or sell securities in jurisdictions where Allio Advisors is not registered.
For content related to taxes, you should know that you should not rely on the information as tax advice. Articles or FAQs do not constitute a tax opinion and are not intended or written to be used, nor can they be used, by any taxpayer for the purpose of avoiding penalties that may be imposed on the taxpayer.