Updated May 2, 2023

Raymond Micaletti, Ph.D.
Macro Money Monitor
Market Recap
Stocks dipped then recovered during the final week of April. The S&P 500 rose less than 1% but the NASDAQ Composite outperformed care of solid earnings reports and stock price reactions, namely from Microsoft. The top-performing sector of the week, Communication Services, was led higher by strong Q1 numbers out of Meta Platforms. Small caps, despite leading equities to the upside on Friday, endured losses for the entirety of April.
On the commodities front, the dollar was virtually unchanged, but the broad commodity index still posted its second straight weekly loss. As oil prices have given back their gains after the OPEC-plus production cut news, gold has likewise dipped. The yellow metal ended last week under the key $2,000 psychological mark following some encouraging economic and earnings data lately.
Bonds rose last week despite a probable Fed rate hike on the way – inflation-protected Treasuries were also fractionally positive. Finally, the Real Estate sector boasted robust gains amid slightly lower yields.
Tech Stocks Lead the Way to Cap Off April, Oil Slips, Real Estate Rallies
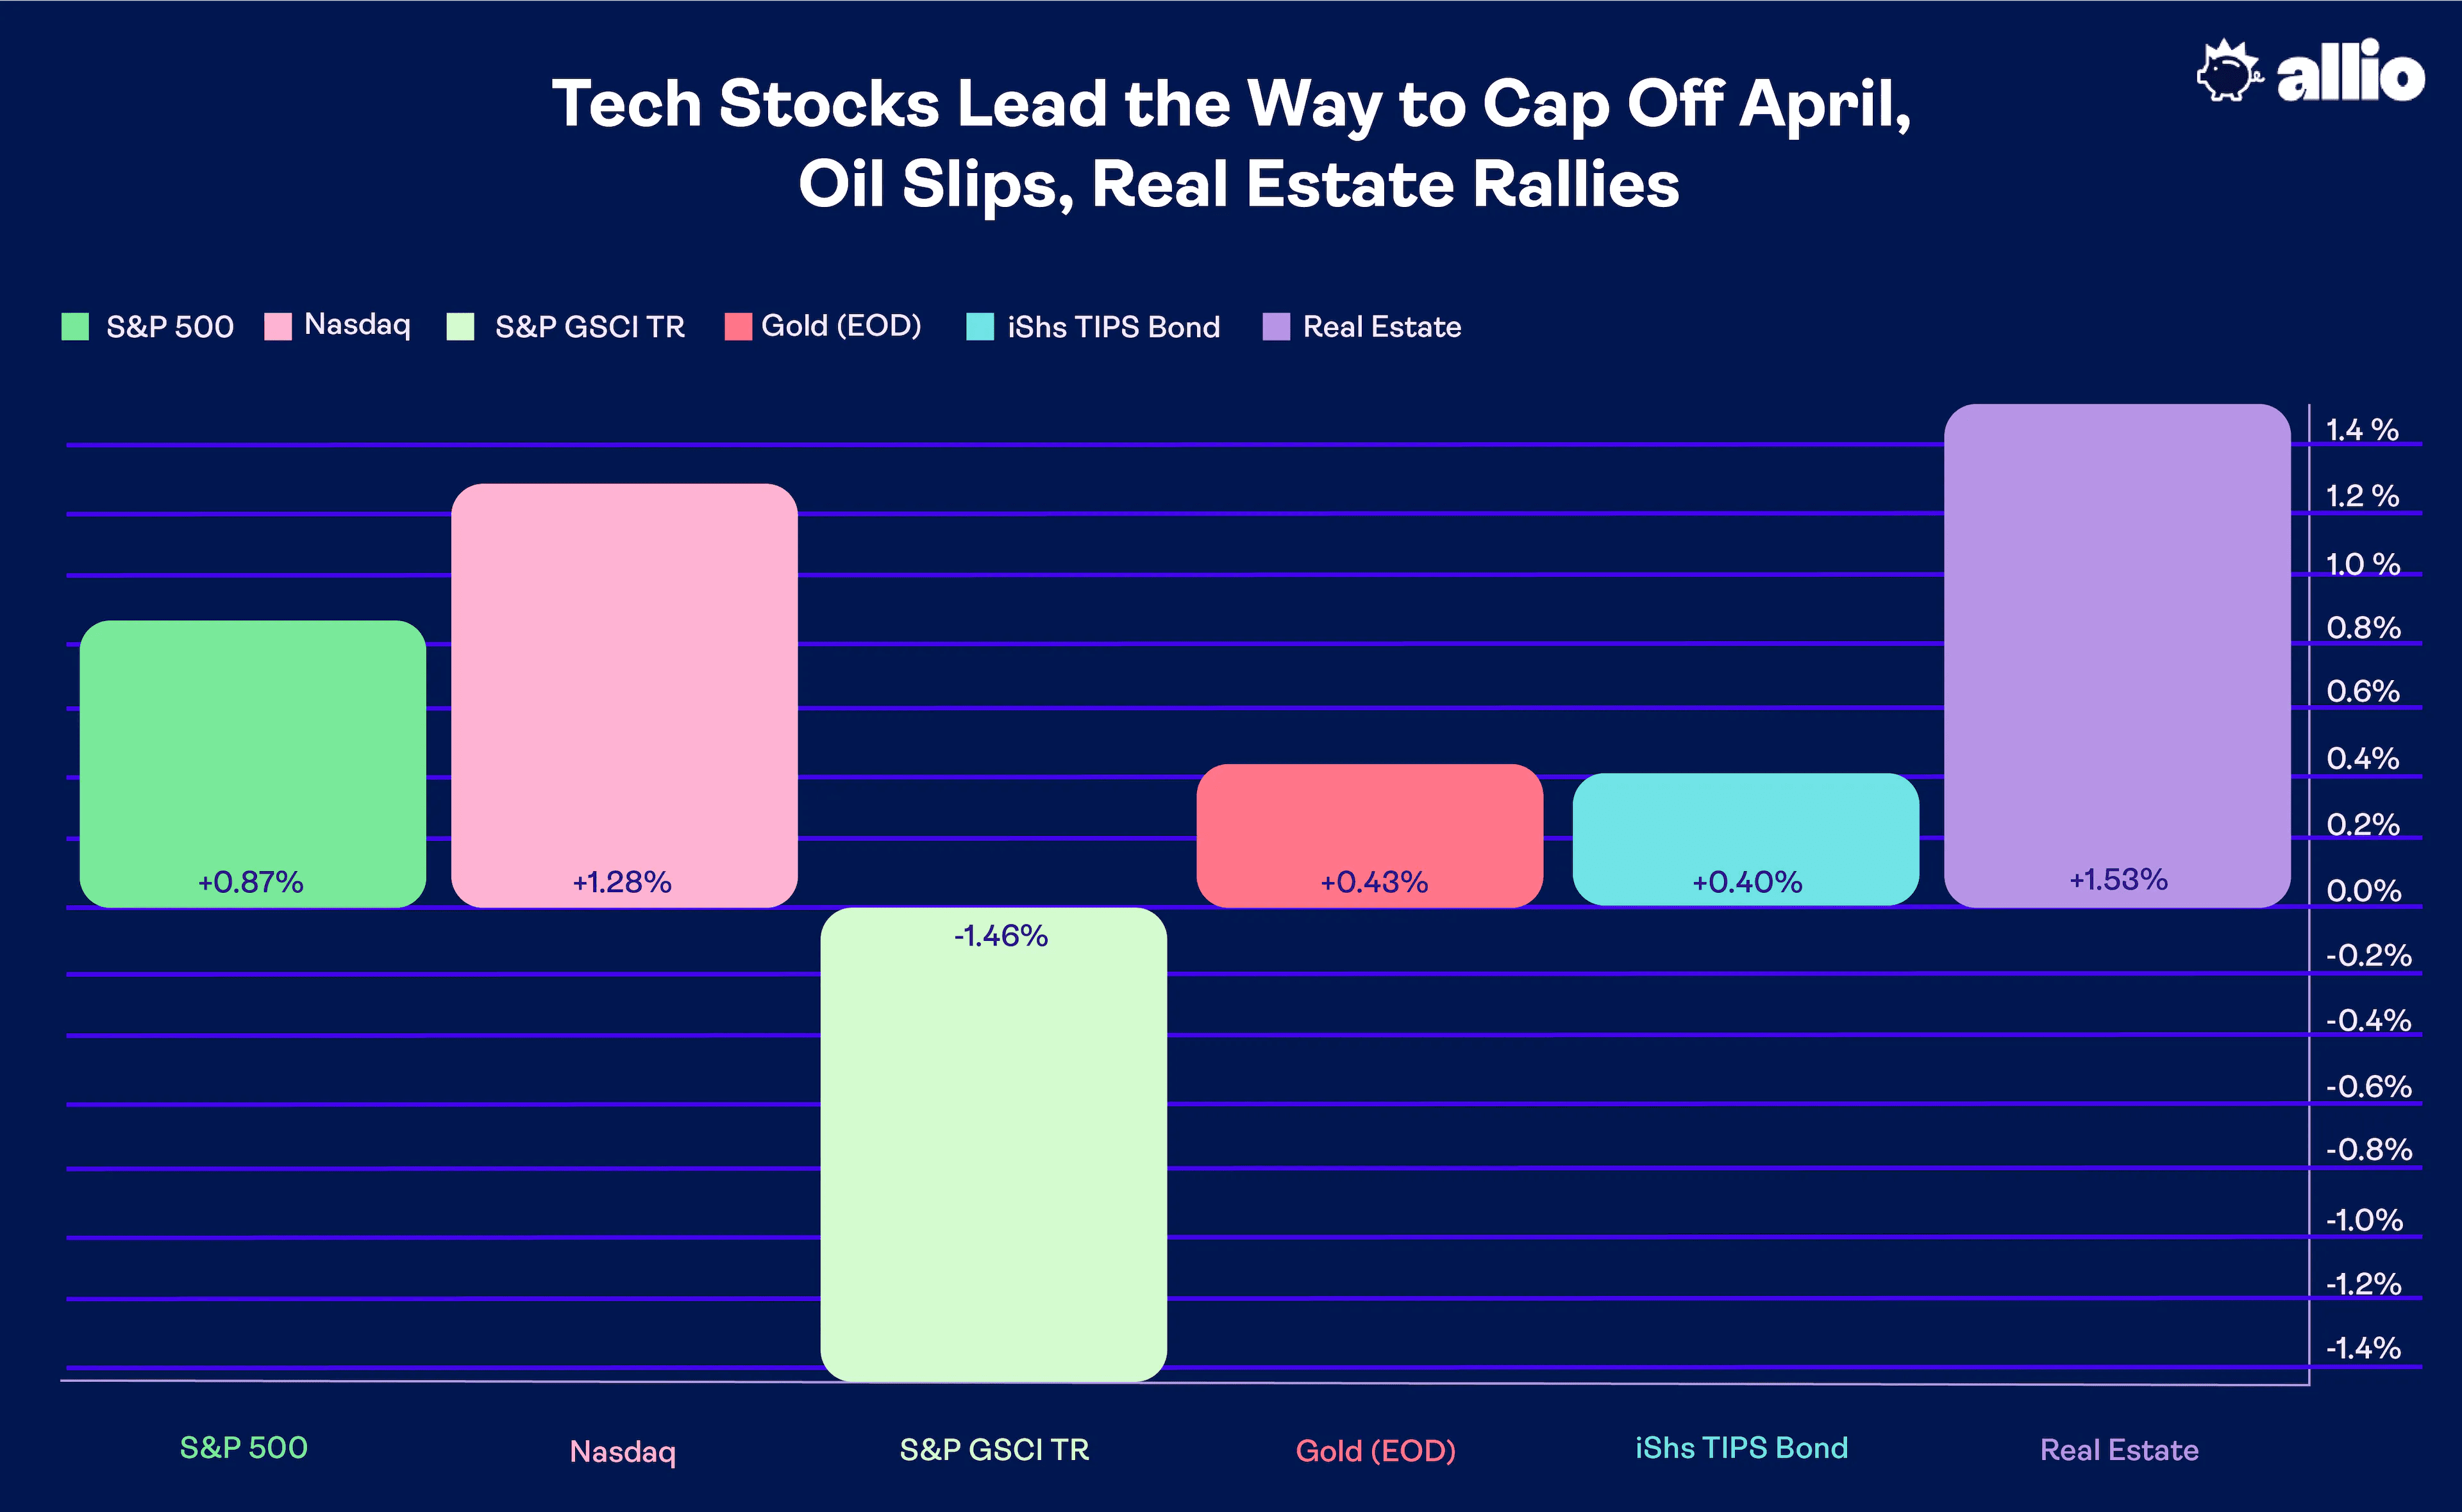
April 21, 2023 - April 28, 2023
Big Tech to the Rescue?
We just got through the busiest week of earnings season on Wall Street, and the results are encouraging for the bulls. Consider that 79% of S&P 500 companies have topped bottom-line expectations while 74% of firms are beating on revenue, according to FactSet.
The EPS beat rate is above the 5-year average which helps to assuage fears of an imminent profit slowdown. The bears will point to depressed expectations coming into the start of the first-quarter reporting season: Recall last summer when the consensus estimate for the S&P 500 2023 aggregate EPS was north of $250. That figure hovers near $221 today.
Still, positive numbers from Microsoft and Meta eased jitters about the severity of an earnings recession. That pair of sanguine reports came after lousy figures from Tesla the previous week. Alphabet and Amazon reported mixed results with all eyes on how those firms’ cloud services businesses were fairing. Microsoft’s Azure is seen taking market share while Amazon’s AWS is experiencing a growth slowdown.
Last Week’s Returns: TSLA, AMZN Underperform, MSFT, META Lift the NASDAQ
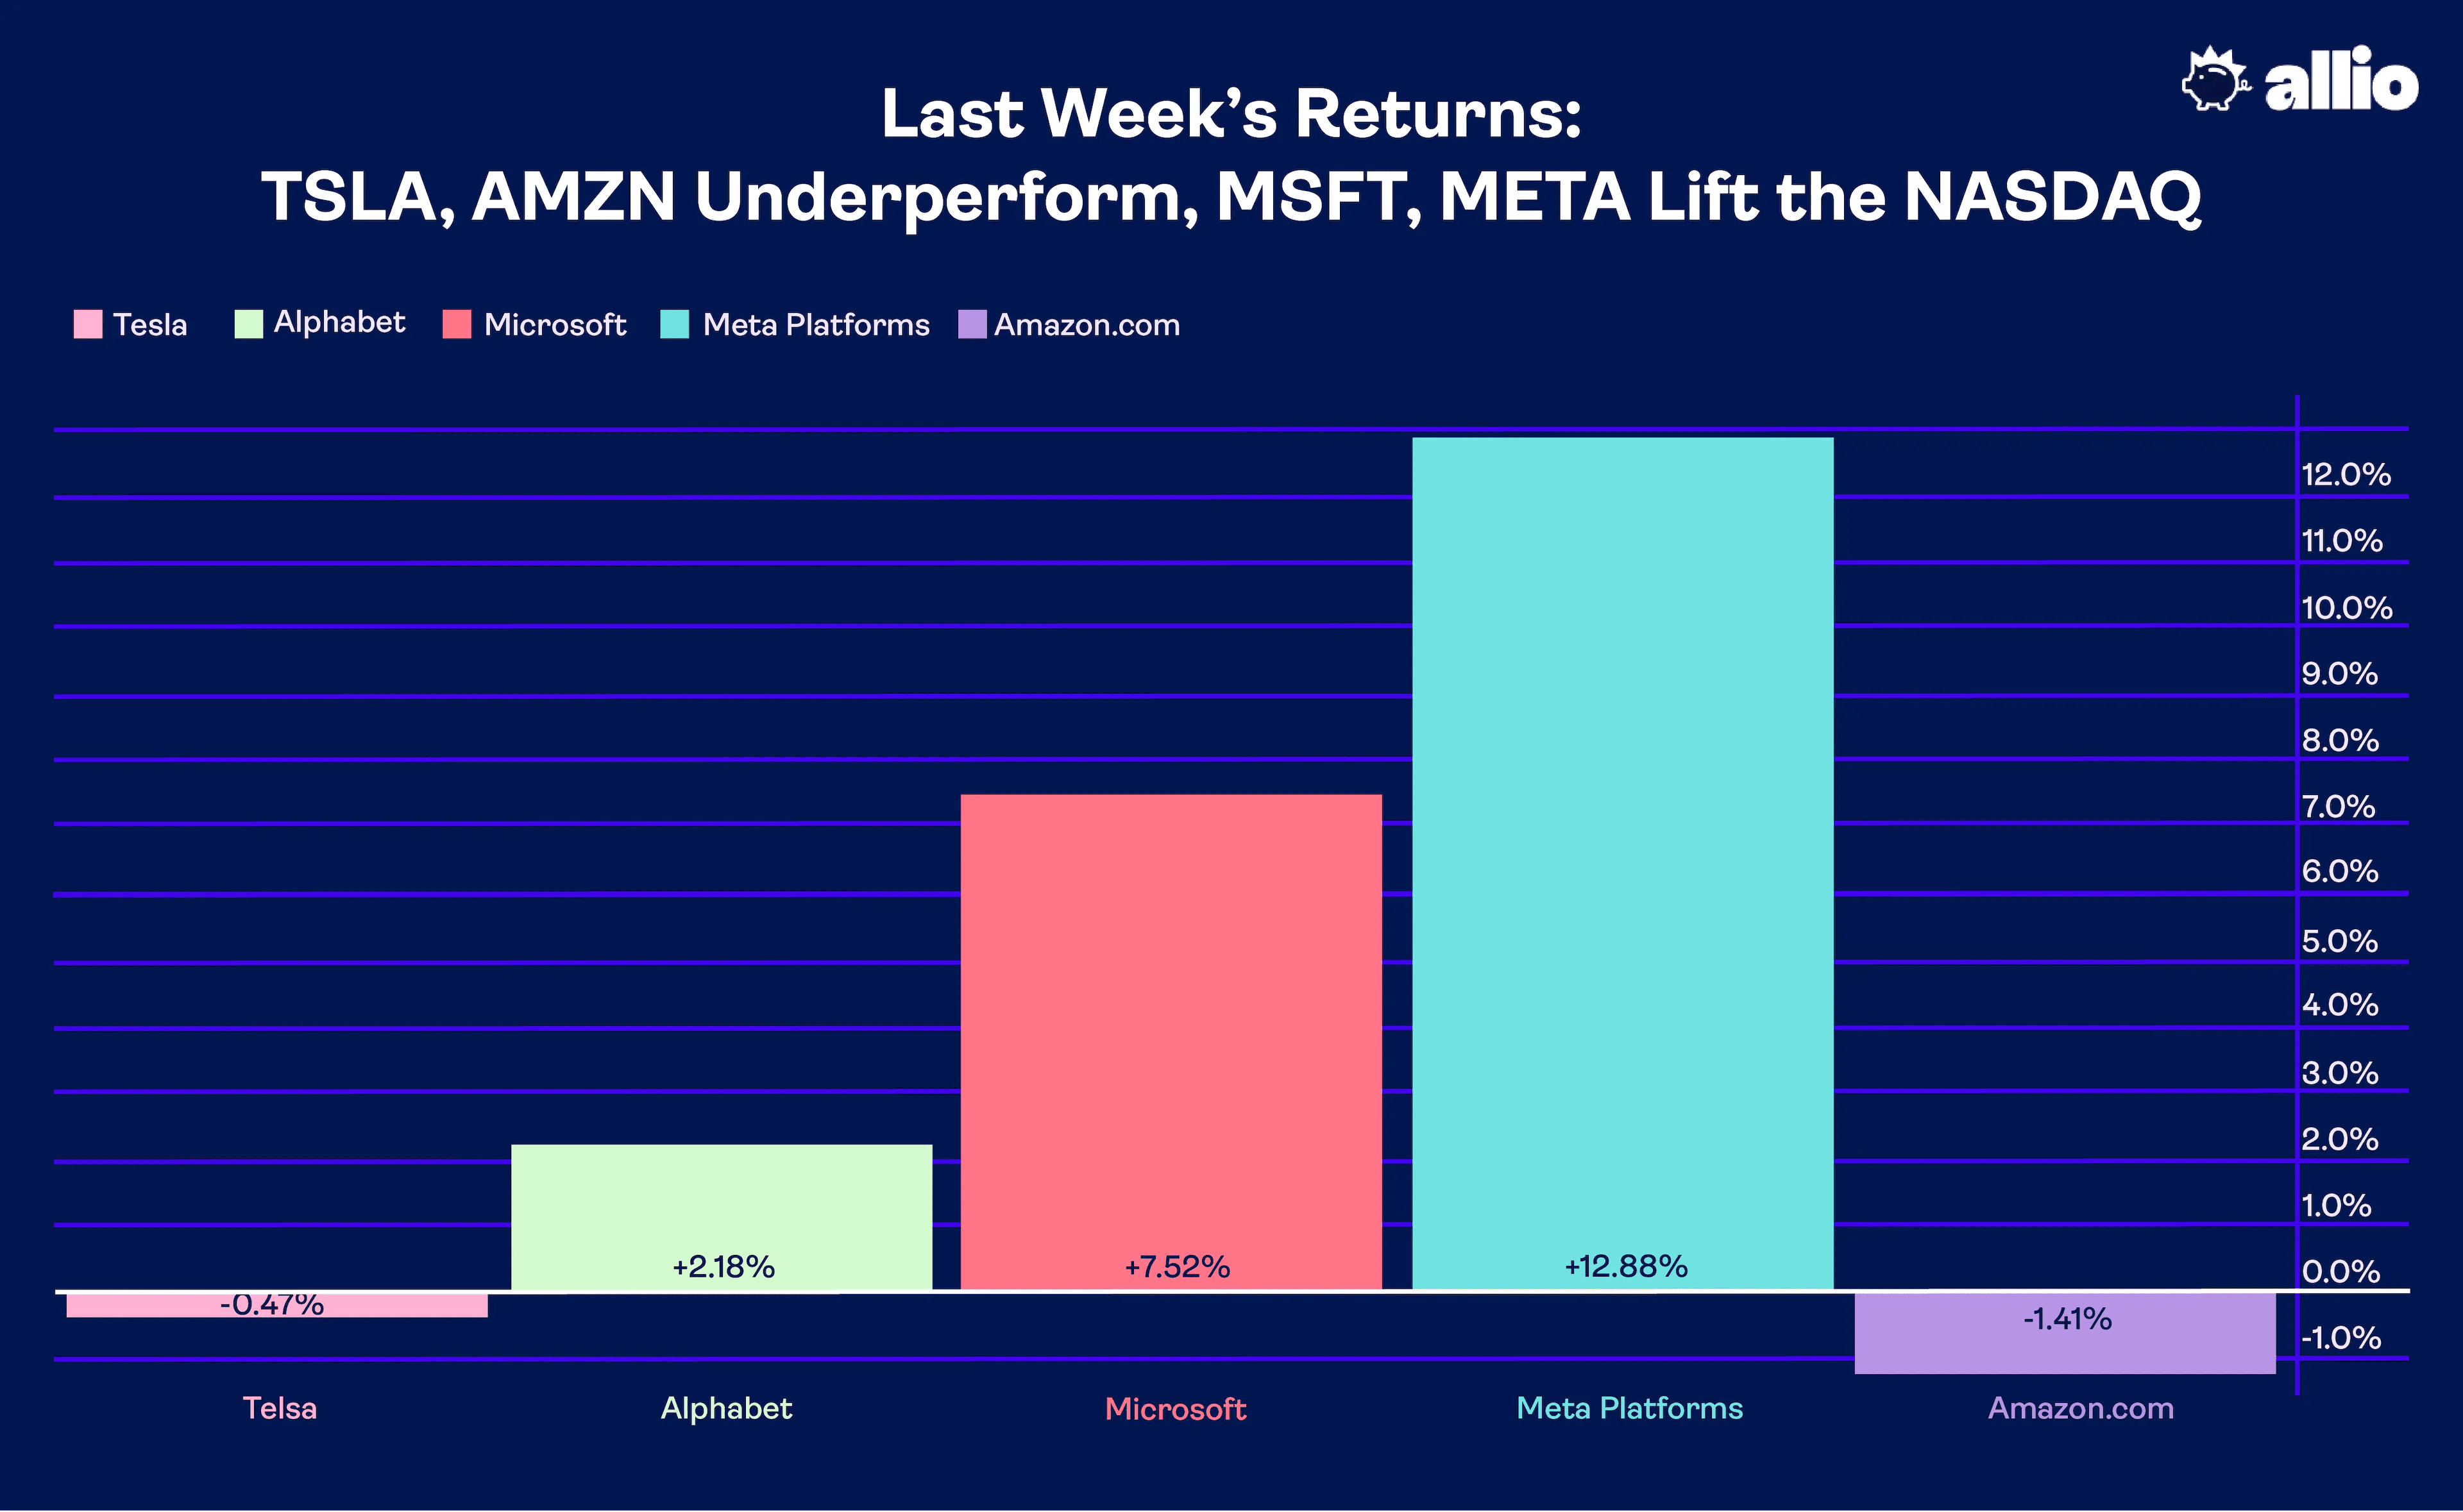
April 21, 2023 - April 28, 2023
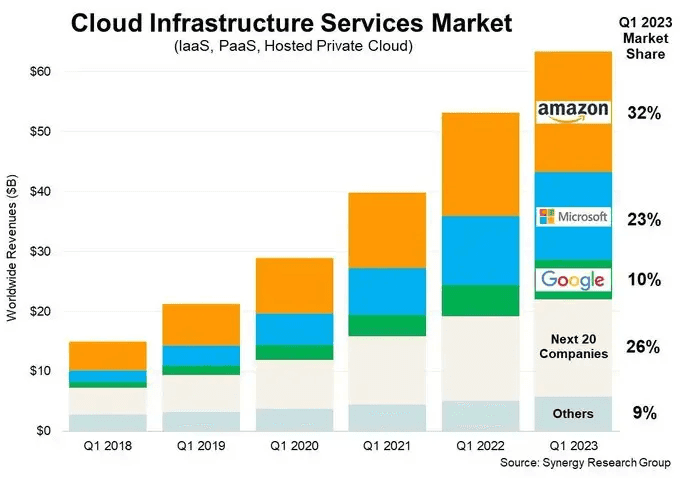
Source: Synergy Research Group
But big picture, the S&P 500’s Q1 earnings growth rate on a year-on-year basis is now expected to be –3.7%. That’s a stark improvement from just a few weeks ago. At the end of Q1, a 6.7% aggregate profit fall was anticipated. Earnings season continues this week with another onslaught of major companies issuing quarterly results before the season wraps up.
The headliner is no doubt Apple on Thursday afternoon. The street forecasts solid iPhone sales to offset softness in Mac demand. Also keep your eye out for an increase in the company’s stock buyback plan. Apple is known to offer conservative guidance, too.
Focusing on Price Action
The earnings season hoopla gets a lot of press, but as investors, we like to focus on how stocks are moving and where they may go from here. Earnings are backward-looking, and we need to keep our eyes on the future.
Let’s home in on the chart of the Nasdaq 100 ETF (QQQ). Earlier this month, we turned bullish on the group based on investor positioning and positive price action. Notice in the chart below that shares may be breaking out; QQQ settled at its highest weekly price since August last year.
The ETF is also about 10% above its 200-day moving average, which has turned higher (a bullish signature). With impressive buying pressure on Thursday and Friday, following the slew of tech earnings reports, momentum appears to be with the bulls. What we like here is that QQQ has established a series of higher highs and higher lows after notching a bottom in October.
Now, this is a tactical trade for us, and we still foresee weakness in the broader market later on which would surely negatively impact QQQ. The bottom line here is that the Nasdaq 100 *maybe* breaking through resistance. We will know more after this week’s bevy of earnings releases and economic data hits.
Eyeing the Macro
Stepping back from earnings and technicals, economic data has been mixed lately. The Q1 GDP report was released last week, and the growth figure of 1.1% verified far below the consensus estimate of 1.9%.
That sounds dire, but the culprit was primarily a reduction of inventories. Businesses shed products as the supply chain crunch continued to ease. If you harken back to late 2021, firms were scrambling to ensure they had enough inventory on hand to meet strong consumer demand for goods. The supply/demand balance for goods has basically reversed. It was the biggest net inventory drawdown (as a percentage contribution to GDP growth) since Q1 of 2021.
The upshot is that it’s likely that inventory could recover later this year, boosting GDP. All the while, consumer spending was impressive in Q1 despite recession fears. A more than two percentage point consumption climb is in “real” terms (net of inflation), as well. Overall, the GDP report was modestly on the weak side, but not soft enough to cause the Fed to pause.
Elsewhere in the macro economy, the consumer sentiment picture continues to appear bleak. The Conference Board’s report on how folks are feeling came in light, and individuals’ collective outlook is even more pessimistic. Moreover, last Friday’s University of Michigan final read on sentiment was close to the forecast with a still-firm inflation expectation, much to the chagrin of the Fed.
Countering the dour soft data were healthy Durable Goods numbers and jobless claims. But there is still plenty of reason for Powell to hike at least one more time given March PCE inflation that was reported to be humming along at a 4.9% clip at the core level.
The Growth Outlook
On Friday, the Atlanta Fed’s GDPnow tracker initiated for the second quarter. As it stands, the model predicts 1.7% annualized real economic expansion in Q2. Wall Street economists’ consensus still calls for a technical recession (two quarters of negative real GDP growth) in Q3 and Q4 this year.
Real GDP Seen Dipping Negative in the Second Half of 2023
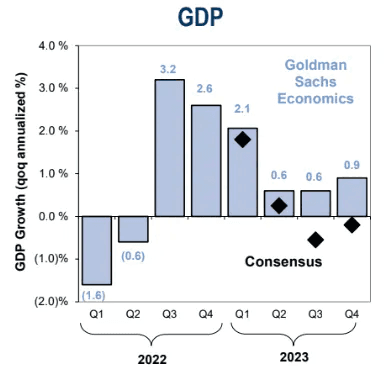
Source: Goldman Sachs
Fasten Your Seatbelts for a Busy Week
Amid uncertainty and macro risks for the second half, the immediate focus is on an active week ahead. The first trading day of the month means we’ll get a fresh read on the manufacturing snapshot. The ISM Manufacturing survey for April hits Monday morning. Then comes the Job Opening and Labor Turnover Survey (JOLTS) Tuesday before the critical May 3 Federal Reserve rate decision. The FOMC gathers for its two-day meeting Tuesday and Wednesday with a press conference Wednesday afternoon (the ECB meets Thursday). The April payrolls report comes on Friday at 8:30 AM ET (+175k consensus). In case you’re wondering, the next CPI report arrives on Wednesday, May 10.
This Week’s Data Deck

Source: BofA Global Research
Pick your poison on the headline-grabber of the week, but the Fed might be it. One more quarter-point rate increase is widely expected (an 84% probability per the CME FedWatch Tool). The Fed Funds futures curve suggests the FOMC will pause there through the September 20 meeting before rate cuts ensue at the November 1 gathering.
By this time next year, the policy rate is priced to be back under 4%. On Wednesday, be on the lookout for any dissenters assuming a hike happens. Chicago’s Austin Goolsbee has been more dovish lately, so he could come out in favor of a pause. If Powell is firm in his language to combat high inflation, stocks could be under pressure, but if the Chair focuses on improving consumer price trends, a “data dependent” policy mindset, and a credit conditions that are “sufficiently restrictive,” then that would be a positive for equities.
Meanwhile, earnings continue to roll in, underscored by the S&P 500’s biggest company issuing Q1 numbers Thursday after the bell. As if that’s not enough, don’t sleep in too long this Saturday as “Woodstock for Capitalists” takes place. Value investors' pilgrimage to Omaha, Nebraska will be the talk of finance social media once trading wraps up.
The Elephant in the Room: The Debt Ceiling Debacle
Gridlock on Capitol Hill is often a bullish setup for equities. Usually, a split Congress with a Democratic POTUS is a recipe for a strong stock market when analyzing historical trends. But when battles wage in D.C., a tug-of-war sometimes happens with the debt ceiling. We won’t get into the political mud here. Rather, we will focus on what the market expects and make moves from there.
Previous debt ceiling arguments led to some volatility in the S&P 500, but then an eventual return to normalcy. Right now, trouble is brewing, though. How can we tell? Take a look at pricing on the 1-year U.S. credit default swap. It is now above 1.75% - far above the peaks from previous crisis moments.
U.S. Default Risks Rising
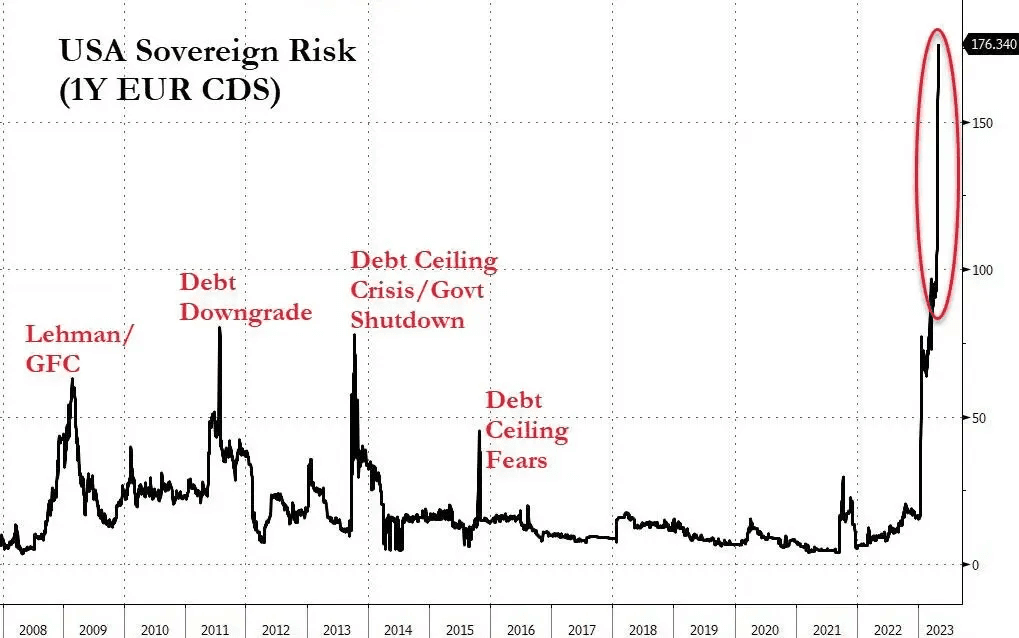
Source: Zero Hedge
We dug deeper to zero in on when volatility could really strike. The Treasury bill yield curve shows a pronounced spike in early June. The rate jumps from about 4.1% to nearly 5% over just a few weeks during that span. That’s rarely seen in the normally smooth Treasury yield market.
As the stalemate persists, investors should monitor that timeframe for enhanced potential volatility. It didn’t help that tax receipts through the April 18 filing deadline were lower compared to previous years – that pulled forward debt ceiling risks.
Debt Ceiling Risks Seen Peaking in Early June
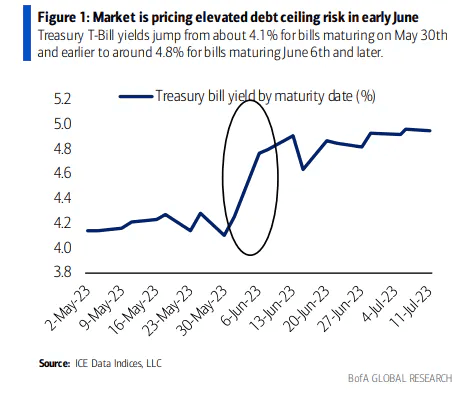
Source: BofA Global Research
Low Tax Collection this Season Compared to 2022, Pressuring the Treasury Budget
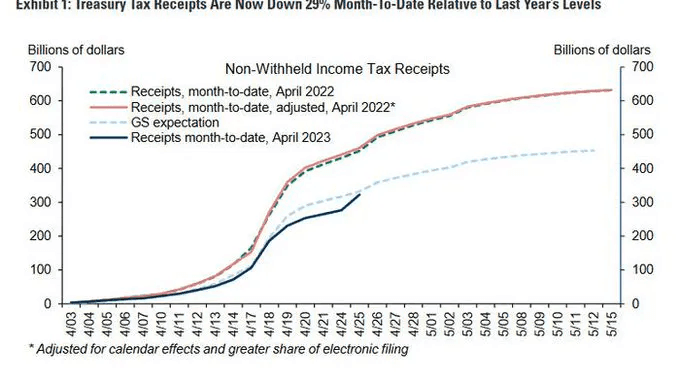
Source: Goldman Sachs
Volatility Dips to 17-Month Lows. What Gives?
An earnings onslaught, major economic data hitting, a Fed decision, and the potential for a sovereign debt downgrade – you might figure the VIX would be on the rise. Not so.
The VIX baffled many traders last week as it settled at the lowest level since early November 2021. It nearly notched the calmest weekly close since February 2020. Are investors simply looking past all these potential volatility catalysts? Maybe in the near term, but step out on the VIX futures curve, and the picture illustrates a different landscape.
The VIX is seen as rising into the mid-20s in the third quarter, so markets may be calm in the next several weeks before the road turns bumpier as we approach the destination (which could be a recession by year-end).
VIX Futures Curve: Increasing Volatility Priced In Later In 2023

Source: VIX Central
The Bottom Line
Our call for a short squeeze in stocks and a drift higher has played out lately. So many investors are still caught on the wrong side of the market. But the bullish window may be closing soon as risks mount. At the same time, price action is decent in tech stocks, so we continue to hang out there with a tactical long trade.
Our macro monitor’s iris will be open wide this week with a flurry of data on all fronts. No rest for the weary. We’ll check back next week to see how the dust has settled.
Want access to your own expert-managed investment portfolio? Download Allio in the app store today!
Related Articles


The articles and customer support materials available on this property by Allio are educational only and not investment or tax advice.
If not otherwise specified above, this page contains original content by Allio Advisors LLC. This content is for general informational purposes only.
The information provided should be used at your own risk.
The original content provided here by Allio should not be construed as personal financial planning, tax, or financial advice. Whether an article, FAQ, customer support collateral, or interactive calculator, all original content by Allio is only for general informational purposes.
While we do our utmost to present fair, accurate reporting and analysis, Allio offers no warranties about the accuracy or completeness of the information contained in the published articles. Please pay attention to the original publication date and last updated date of each article. Allio offers no guarantee that it will update its articles after the date they were posted with subsequent developments of any kind, including, but not limited to, any subsequent changes in the relevant laws and regulations.
Any links provided to other websites are offered as a matter of convenience and are not intended to imply that Allio or its writers endorse, sponsor, promote, and/or are affiliated with the owners of or participants in those sites, or endorses any information contained on those sites, unless expressly stated otherwise.
Allio may publish content that has been created by affiliated or unaffiliated contributors, who may include employees, other financial advisors, third-party authors who are paid a fee by Allio, or other parties. Unless otherwise noted, the content of such posts does not necessarily represent the actual views or opinions of Allio or any of its officers, directors, or employees. The opinions expressed by guest writers and/or article sources/interviewees are strictly their own and do not necessarily represent those of Allio.
For content involving investments or securities, you should know that investing in securities involves risks, and there is always the potential of losing money when you invest in securities. Before investing, consider your investment objectives and Allio's charges and expenses. Past performance does not guarantee future results, and the likelihood of investment outcomes are hypothetical in nature. This page is not an offer, solicitation of an offer, or advice to buy or sell securities in jurisdictions where Allio Advisors is not registered.
For content related to taxes, you should know that you should not rely on the information as tax advice. Articles or FAQs do not constitute a tax opinion and are not intended or written to be used, nor can they be used, by any taxpayer for the purpose of avoiding penalties that may be imposed on the taxpayer.