Updated June 6, 2023

Raymond Micaletti, Ph.D.
Macro Money Monitor
Market Recap
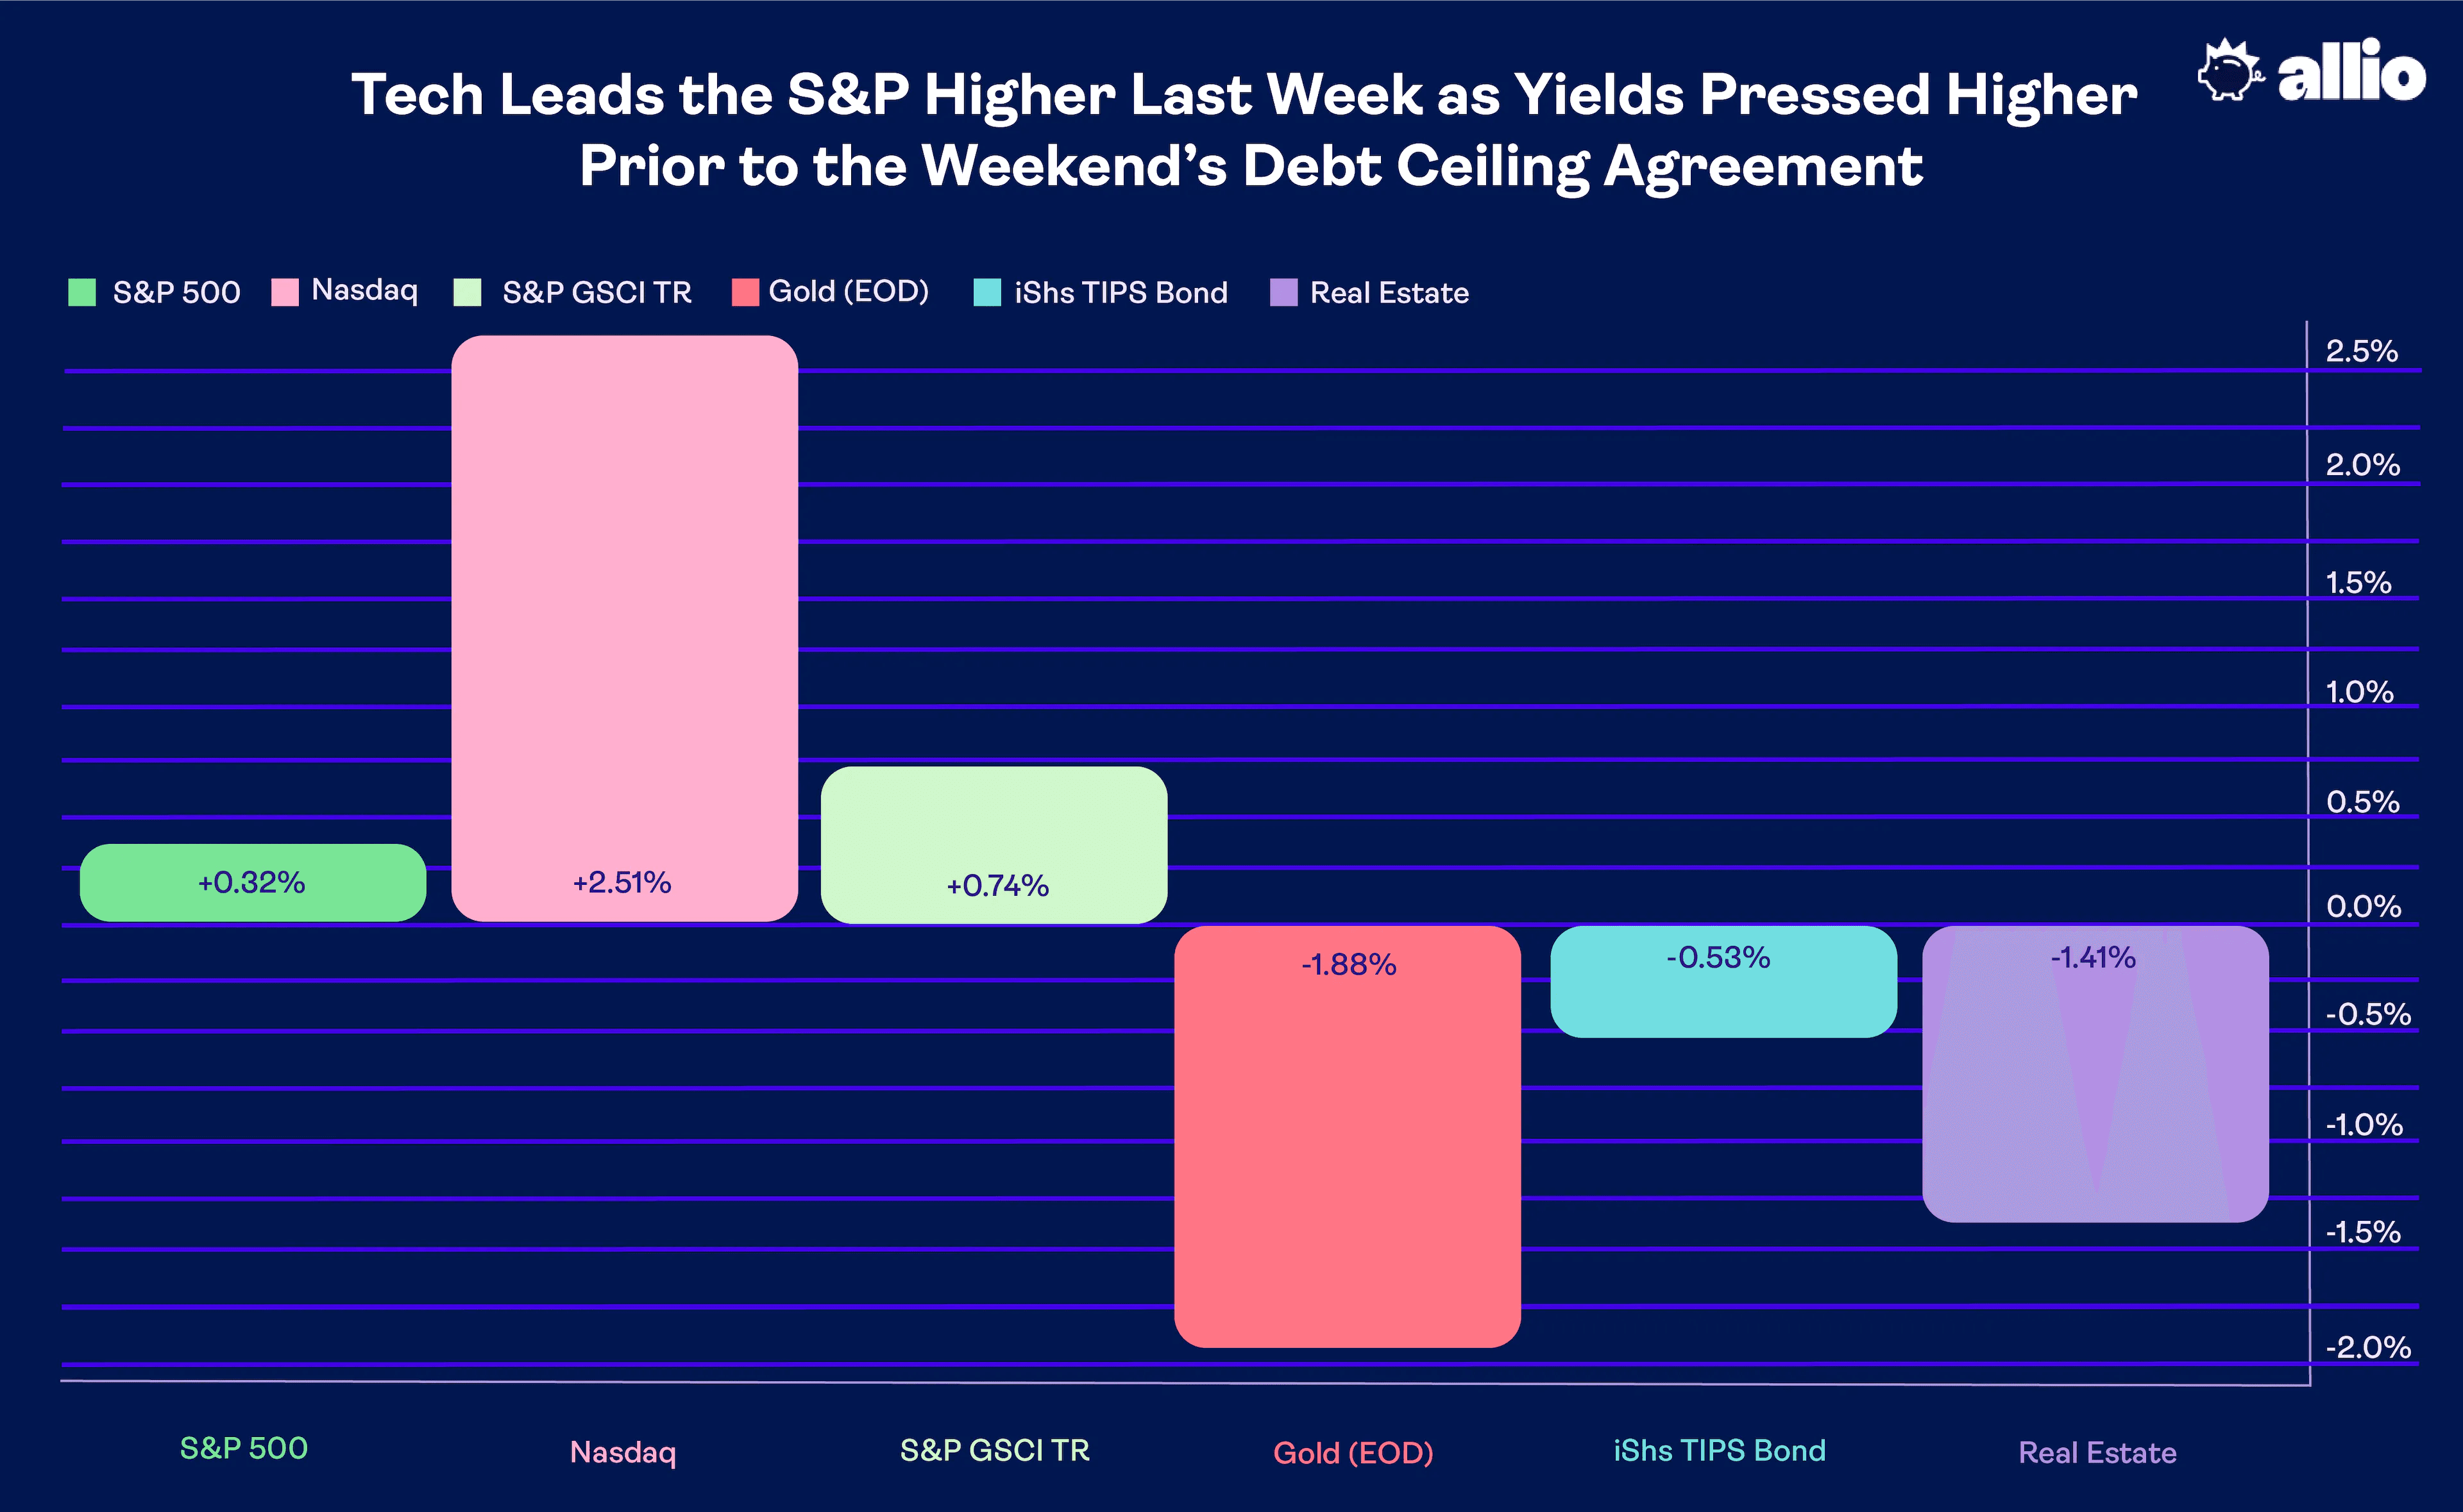
Tech stocks led the way last week with the NASDAQ Composite rallying 2.5% while the broader S&P 500 notched a 0.3% gain. The big story was the surge in semiconductor stocks, highlighted by NVIDIA's meteoric rise to touch the $1 trillion market cap club for a moment last Thursday.
Elsewhere, the Real Estate sector suffered a 1.4% drop as interest rates continued to rise. The yield story also impacted the precious metals market – the spot price of gold fell nearly 2% as it drifts further away from making all-time highs. The commodity index writ large managed a 0.7% weekly advance, though, led by a decent gain from WTI crude oil. Finally, the TIPS market edged lower, but inflation expectations have been back on the rise lately.
For the year, the S&P 500 is up 9.5%, the NASDAQ has rallied 24%, commodities are down 8%, gold sports a 6.5% gain, TIPS have returned 1.9%, and Real Estate equities are off by 2.6% (including dividends).
May 19, 2023 - May 26, 2023
Crisis Averted?
The White House and Republicans in the House of Representatives reached a tentative deal Saturday night to lift the debt ceiling. The agreement comes with steep spending cuts, according to Speaker McCarthy. It's a 2-year package with no budget caps after 2025, and a vote is expected to take place on Wednesday. This comes as Treasury yields have been on the rise. The rate on the 1-year bill had surged to fresh cycle highs last week, driven up by fears that the U.S. could default on an interest payment or two this quarter.
Treasury Yields’ Steep Rise Since Early May
It was just a few weeks ago when fears of a recession gripped markets, leading many pundits to believe that the Federal Reserve was through with its rate hike cycle. Now, though, bond traders have apparently priced in further tightening, but is there more to the story? Later, we’ll outline why there’s now some nuance to the Fed outlook. Either way, with the 2-year yield spiking above 4.5% last week and the 30-year playing hopscotch around the 4% mark, bonds once again offer a compelling alternative to equities.
A Resilient Stock Market
Despite jitters around uncertain outcomes regarding the debt ceiling saga, the S&P 500 settled a fresh closing high dating back to August last year. It’s said that Wall Street loves to “climb the wall of worry” - it is a way to force the hands of bears to capitulate. As stocks rose throughout May, strategists were wondering if the debt ceiling agreement – assuming it happened – would spark a “sell the news” event. That remains to be seen, but the S&P 500, as of last Thursday, traded at a 17.8 price-to-earnings ratio.
We can dig deeper, though. If we assume the next four quarters of earnings estimates are correct, then large-cap US stocks are about 18.2x using Friday’s 4205 closing level. That’s below the 5-year average of 18.5 but above the 10-year mean of 17.3, according to FactSet.
Valuations In Context
Given where rates are, that is on the expensive side versus history, but the valuation is not overly stretched. You have to consider the sector makeup of the S&P 500 today. It’s, of course, dominated by tech and tech-related companies that rightfully command a higher P/E ratio than, say, banks and utility companies. And last week, we witnessed why some of those firms warranted a lofty earnings multiple.
The AI Boom Goes Mainstream
The headline-grabbing earnings story during the first-quarter reporting season wasn’t JP Morgan or Apple. NVIDIA (NVDA) stunned Wall Street with a blowout outlook for 2023. Now the world’s 5th biggest publicly traded company, Q1 revenue and earnings figures indeed beat estimates, but it was its Q2 guide that was something to behold. Revenue is expected to hit $11 billion for the current quarter versus a consensus forecast of just $7.11 billion.
The massive sales increase is driven by AI chip demand. NVIDIA has gone from a gaming semiconductor provider to a dominant data center supplier to, now, the face of AI. Some pundits described the tech company’s Q2 guide as AI’s “big bang” moment.
NVDA Rockets Higher Post-Earnings, Rising 24% on Thursday
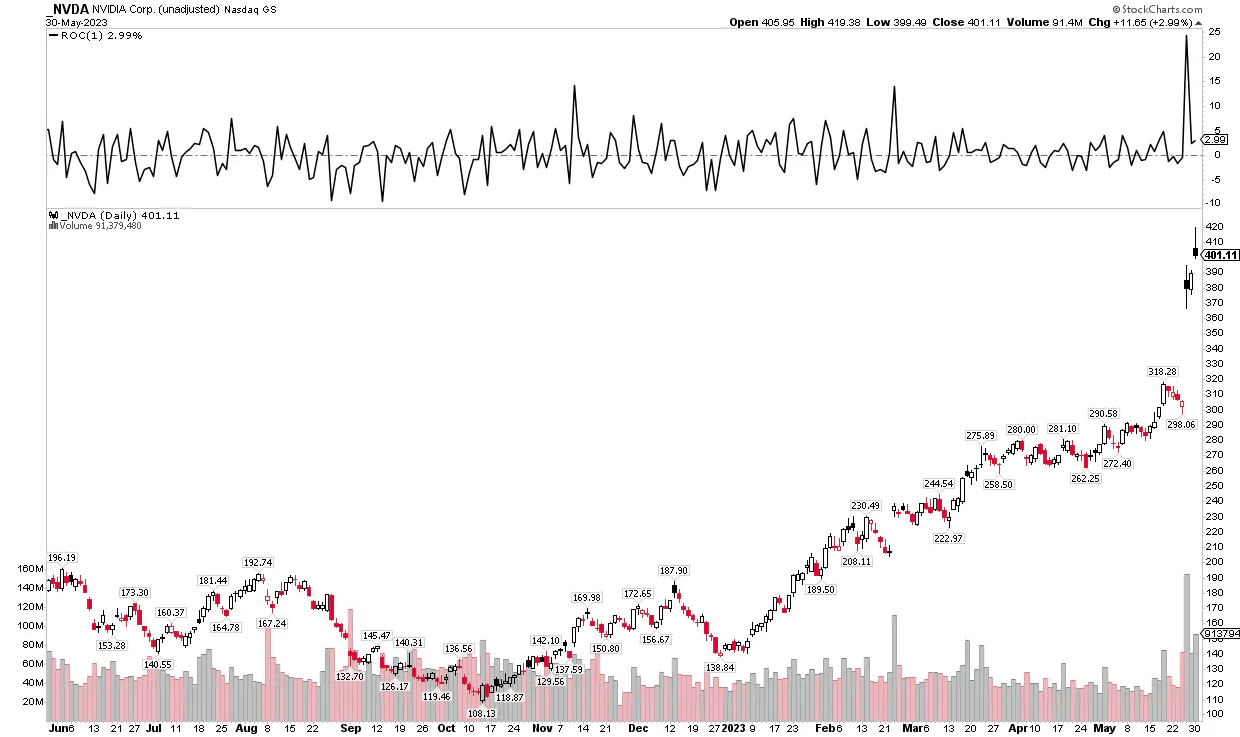
Source: Stockcharts.com
NVDA’s Jolt
Shares jumped 24% in response to the blockbuster Q1 release and followed up that climb with a modest rise last Friday. Volume was the highest seen in its history when considering total dollars traded. The more than $180 billion single-day value rise was more than the market caps of the likes of Adobe, Nike, Disney, and Netflix. But has the tech giant gotten too expensive? We think so. You can check out why buying the stock today is likely a fool’s errand for investors with a multi-year time horizon. There could be more semiconductor fervor this week when Broadcom (AVGO) reports its results on Thursday evening amid a slew of retail names providing Q1 numbers.
NVIDIA’s Bullish Re-Rating in Context

Source: Bloomberg
The Week Ahead: Key Housing and Jobs Data
Getting back to the macro, the Fed will have a lot to digest this week. Housing data and employment readings are front and center. While the S&P Case Shiller Home Price Index hits early Tuesday, higher mortgage rates cast an ominous shadow on the state of the embattled Real Estate sector.
The average 30-year fixed rate mortgage hit 7.12% late last week as the yield on the 10-year Treasury rose above 3.8%. That will further pressure first-time home buyers as it had appeared a housing recovery was taking place. But with virtually full employment and some excess savings, many Gen Z and millennials are still shooting to become homeowners.
New Home Sales Increasing, But Will a Renewed Trend of Rising Mortgage Rates Derail the Optimism?
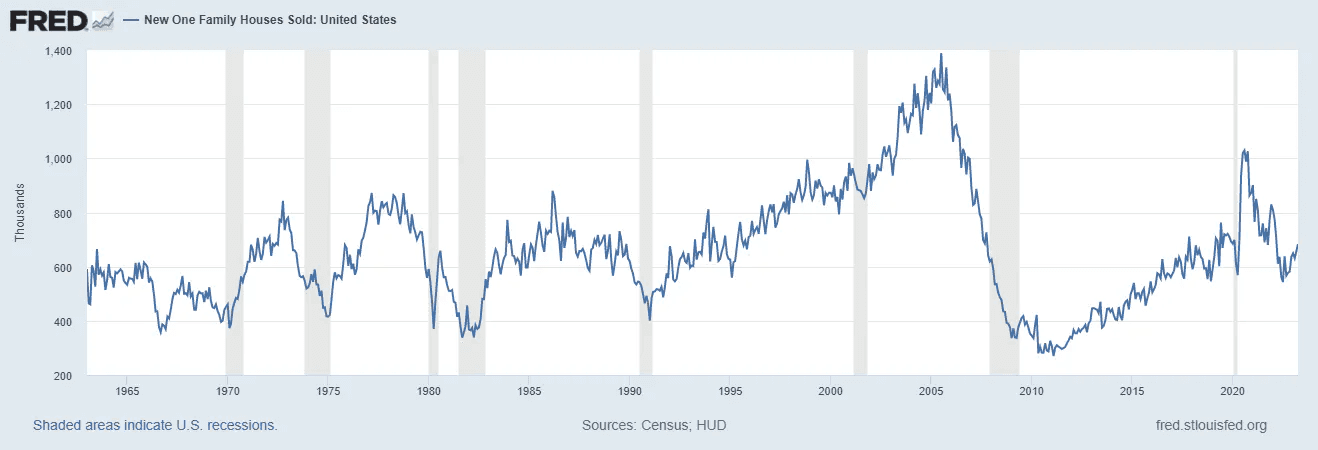
Source: St. Louis Federal Reserve
Powell’s Eyes Laser Focused on New Data
We'll get fresh reads on the labor market this week to see if any cracks are emerging. Mortgage application data comes on Wednesday morning of the holiday-shortened week before the employment market onslaught begins. First up is the April look at the Jobs Opening and Labor Turnover Survey (JOLTS) Wednesday at 10 a.m. ET which Fed Chair Powell said he still pays close attention to during remarks earlier this month. While the response rate to that survey has been terrible in the last two years, it is still one of the major market-moving indicators.
JOLTS’ Response Rate Is Down but Remains Among the Fed Chief’s Favored Labor Market Barometers

Source: Goldman Sachs
Data Dumps Thursday & Friday
Weekly Jobless Claims hit the tape Thursday morning as usual, and the distortions from fraud activity in the Massachusetts total have apparently passed. Revised initial claims data underscore a still-tight employment picture nationwide – particularly among low-tax states. Later in the morning on Thursday, the ISM Manufacturing report for May is expected to show a contraction with a consensus forecast of 47.0 (any number below 50 indicates recession-level manufacturing activity).
Within the report, there will be key Prices Paid and Employment sub-readings. Ahead of Friday’s official Nonfarm Payrolls release is the ADP private sector labor market gauge which is seen at 160,000 jobs created for May. Friday’s Department of Labor report is expected to reveal yet another robust monthly jobs gain of +180,000 with an unemployment rate tick-up to 3.5%.
This Week’s Data Deck

Source: BofA Global Research
FedSpeak & The Beige Book
Amid that flurry of economic indicators to cross the wires, there’s FedSpeak this week. After some hawkish words by recently voting-member Mester and non-voting member Bullard, Tuesday through Thursday feature speaking engagements from a few on the FOMC. Also, the Fed’s Beige Book of regional survey data is released Wednesday at 2 p.m. ET.
Putting It All Together: Fed Rate Decision in Two Weeks
By Friday afternoon, we will have a much better idea of where Fed policy goes from here. As mentioned earlier, the market had priced in another rate hike by July. As of the close on Friday, there was a 64% chance of a rate rise at the June 14 meeting while expectations were for a terminal rate above 5.3% after the July 26 FOMC gathering. But those numbers might not be what they seem.
Here’s why: T-bill yields were pressured higher care of debt ceiling fears. The annualized 3-month T-bill rate shot up to 5.4%, the highest since January 2001 while the 1-month yield climbed above 6% for a moment last Friday. Now that a deal has been made, the rate market can calm down, and that should cause the Fed Funds futures market to normalize.
Keeping Your Cool
Investors mustn’t get too caught up chasing yield today. While short-term rates are elevated and provide a comfortable alternative to seemingly risky stocks, Gen Z and millennials have time on their side. History shows that there has never been a 20-year period in which the S&P 500 last turned in a negative performance. While a single day is basically a coin flip when it comes to gains or losses on Wall Street, the probability of positive returns increases over time. And data show stocks consistently beat Treasuries over the long haul.
Time Is an Investor’s Best Friend

Source: BofA Global Research
A Troubling Turn of Events Internationally
Turning to the broader economic landscape, recent US data have been to the good side while China’s reopening sputters and troubling news out of Europe casts doubt on global GDP growth for 2023. Last week, the German economy confirmed a technical recession. The Euro Area’s biggest player endured two straight quarters of negative GDP growth.
Meanwhile, the UK is still fighting terrible inflation. Last Wednesday, Core CPI notched its biggest annual increase on record at 6.8% in the UK, much hotter than the +6.2% forecast. Given those troubling trends across the pond, and a 20% youth unemployment in China, the US Dollar Index (DXY) has been on a tear lately.
US Dollar Index: Higher Three Consecutive Weeks
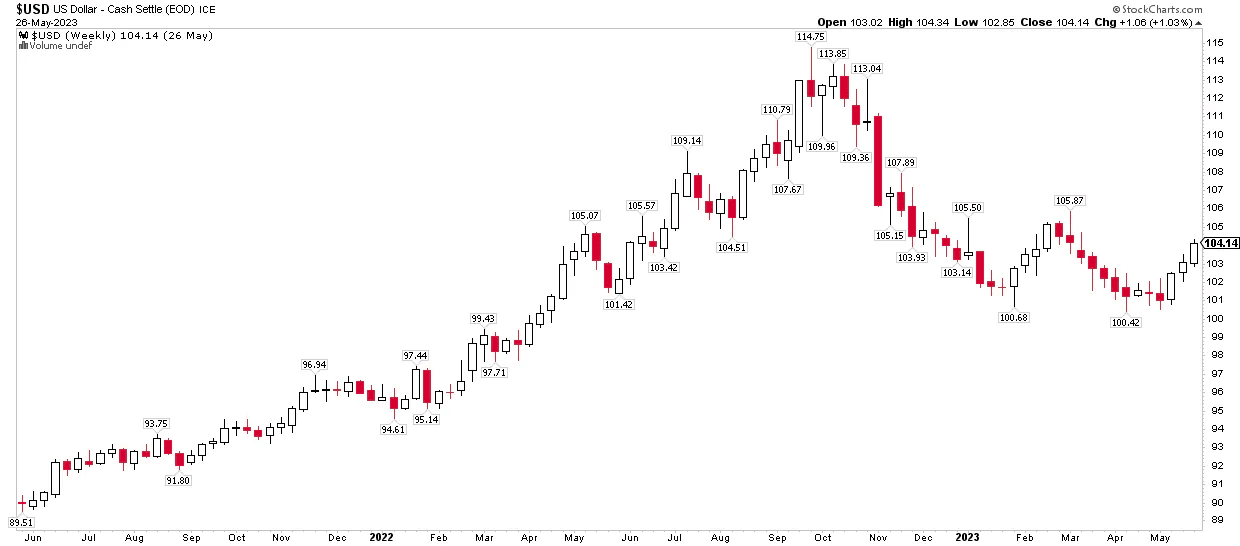
Source: Stockcharts.com
Recession Risks Pushed Out Again
The greenback ended last week at its best levels on a trade-weighted basis since the domestic regional banking crisis in early and mid-March. The DXY had threatened to break below the key 100 level back in April and early May, but its resurgence to above 104 suggests that the economy at home is now seen as humming along better compared to arguably weaker growth outlooks abroad.
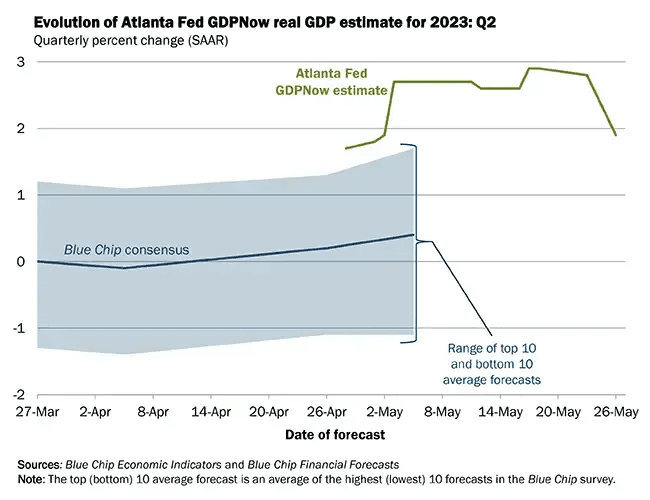
While lackluster trade data last week sent Q2 GDP forecasts down, the ever-looming recession continues to be put off. As it stands, this quarter’s inflation-adjusted growth rate is seen at 1.9% by the Atlanta Fed’s GDPNow model, and that’s about on par with what private-sector economists are predicting.
Another Quarter of Decent US GDP Growth Expected in Q2
Source: Atlanta Federal Reserve
The Bottom Line
You might not have been around the investing world in the late 90s. But many of Allio’s hedge fund veteran portfolio managers were. This year’s remarkable rallies in the NASDAQ and within the Tech sector are starting to feel like 1999. NVDA’s monster move last week (taking other AI-related stocks with it) was reminiscent of Cisco and Qualcomm back in the day.
Investors young and old must keep an even keel when froth starts building. We have written about how we like the tech sector and have favored it as an overweight much of this year, but continuing to be nimble while prudent may reap rewards as the summer ensues.
Want access to your own expert-managed investment portfolio? Download Allio in the app store today!
Related Articles


The articles and customer support materials available on this property by Allio are educational only and not investment or tax advice.
If not otherwise specified above, this page contains original content by Allio Advisors LLC. This content is for general informational purposes only.
The information provided should be used at your own risk.
The original content provided here by Allio should not be construed as personal financial planning, tax, or financial advice. Whether an article, FAQ, customer support collateral, or interactive calculator, all original content by Allio is only for general informational purposes.
While we do our utmost to present fair, accurate reporting and analysis, Allio offers no warranties about the accuracy or completeness of the information contained in the published articles. Please pay attention to the original publication date and last updated date of each article. Allio offers no guarantee that it will update its articles after the date they were posted with subsequent developments of any kind, including, but not limited to, any subsequent changes in the relevant laws and regulations.
Any links provided to other websites are offered as a matter of convenience and are not intended to imply that Allio or its writers endorse, sponsor, promote, and/or are affiliated with the owners of or participants in those sites, or endorses any information contained on those sites, unless expressly stated otherwise.
Allio may publish content that has been created by affiliated or unaffiliated contributors, who may include employees, other financial advisors, third-party authors who are paid a fee by Allio, or other parties. Unless otherwise noted, the content of such posts does not necessarily represent the actual views or opinions of Allio or any of its officers, directors, or employees. The opinions expressed by guest writers and/or article sources/interviewees are strictly their own and do not necessarily represent those of Allio.
For content involving investments or securities, you should know that investing in securities involves risks, and there is always the potential of losing money when you invest in securities. Before investing, consider your investment objectives and Allio's charges and expenses. Past performance does not guarantee future results, and the likelihood of investment outcomes are hypothetical in nature. This page is not an offer, solicitation of an offer, or advice to buy or sell securities in jurisdictions where Allio Advisors is not registered.
For content related to taxes, you should know that you should not rely on the information as tax advice. Articles or FAQs do not constitute a tax opinion and are not intended or written to be used, nor can they be used, by any taxpayer for the purpose of avoiding penalties that may be imposed on the taxpayer.