Updated November 13, 2023

Mike Zaccardi, CFA, CMT
Macro Money Monitor
Market Recap
Mega-cap tech stocks powered higher to lead the S&P 500 to a second straight weekly climb. Capped by the Nasdaq’s best session since May on Friday, the SPX rose 1.3% for the week while the Nasdaq jumped 2.4%.
Small caps were conspicuously weak – a trend that has persisted for more than two years now as the Russell 2000’s bear market presses on.
Sector-wise, it was information Technology’s 4.5% surge lifting equities. Energy as well as the rate-sensitive Real Estate and Utilities areas were all down more than 2%.
Elsewhere, we have seen the dollar and interest rates move higher in tandem for much of this year, but the greenback’s 0.8% advance last week came as bonds sold off modestly. TIPS underperformed the aggregate fixed-income market. Gold and oil endured more significant pain – the metal was off 3% and black gold suffered a more than 4% fall.
For the year, the S&P 500 is up 15.0% and the Nasdaq is higher by 31.8%.

November 3, 2023 - November 10, 2023
The Look Ahead
It’s a busy week on the data front following last week’s constant Fed Speak. The focus will be on the October CPI, PPI, and Retail Sales reports. Along with key Q3 earnings reports from retailers, we’ll get fresh clues on the state of the consumer as holiday spending kicks into high gear.
Activities get underway in earnest Tuesday morning with the monthly NFIB Small Business Optimism gauge before CPI hits at 8:30 a.m. ET. A hot reading would almost certainly cause Wall Street strategists to rethink their stance on the chance of an additional rate hike. Last week’s words from Chair Powell were seen as hawkish, leaving the door open to another quarter-point rate increase. The trend lower in inflation is pronounced, however, and October could even print a goose-egg Headline CPI figure.
Wednesday is loaded. Empire Manufacturing PMI for November arrives at the same time as PPI data and the Census Bureau’s October Retail Sales report. Consumers’ feelings turned more downbeat last month, and there have been mixed card-spending trends reported by the major card issuers.
Then on Thursday, a fresh weekly read on initial and continuing jobless claims comes – the trend lately suggests firms are not laying off workers, but also refraining from hiring as the employment situation continues to cool. October Industrial Production is expected to be soft, and the week wraps up with housing data.
Following Moody’s negative warning regarding US debt last Friday night, President Biden and Chinese President Xi Jinping are set to meet on Wednesday in San Francisco. The two leaders will discuss an array of issues, economic policy among them.
This Week's Data Deck: The Focus Will Be On CPI, PPI, and Retail Sales
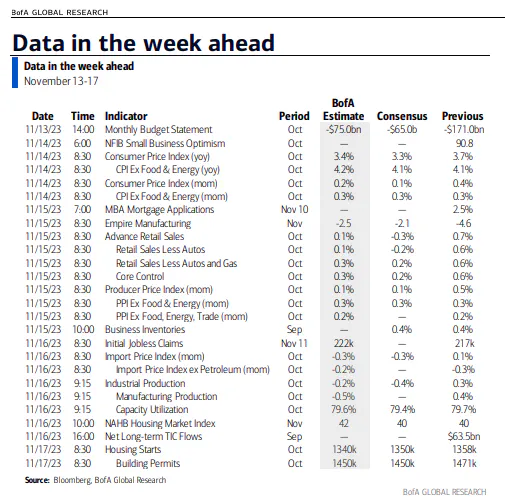
Source: BofA Global Research
Earnings Reports This Week
Ninety-two percent of the S&P 500 has reported Q3 results, and the beat rate is stout at 81% - the best since Q3 2021, according to FactSet. Aggregate earnings so far have verified 7.1% above preliminary estimates, and the blended EPS growth rate for the index is 4.1%, the first positive quarter since the same period a year ago.
Retailers and major Chinese companies are in the earnings spotlight this week. Home Depot (HD) hopes to build on the SPX’s solid results – it reports Tuesday before the bell. Target (TGT) and TJX Companies (TJX) results come Wednesday BMO. Walmart (WMT) reports Thursday morning before Ross Stores (ROST) Q3 numbers arrive in the evening. Elsewhere, market-moving profit figures could come from Tyson (TSN), Tencent (TCEHY), JD.com (JD), Cisco (CSCO), Alibaba (BABA), and Applied Materials (AMAT).
Retail Earnings Season Ensues

Source: Wall Street Horizon
Topic of the Week: Consumers Hitting the Pause Button?
Price action and Fed Speak captured the spotlight last week amid a dearth of macro data. On Friday morning, however, there was a significant surprise in the University of Michigan’s November Surveys of Consumers. The preliminary monthly read on how people feel about the state of the economy, its outlook, and inflation expectations did not paint a rosy picture.
The headline 60.4 index reading was well below the consensus estimate and the weakest since May. Both the current conditions and expectations subcomponents verified worse than economists’ forecasts, but of particular concern were Americans’ feelings on inflation. Usually, as gas prices go, so go inflation expectations, but at 4.4% and 3.2% on the year-ahead outlook and 5-10 year expectation, there’s a perceived ongoing inflation risk.
The Fed pays close attention to these barometers since workers are more likely to demand wage increases if they believe elevated inflation is entrenched in the economy. A 12-year high in the 5-10 year inflation expectations subindex is cause for concern. Price action quickly looked beyond the UMich report as stocks soared after initially buckling in reaction to the 10 a.m. ET report. Treasury yields were also impressively muted heading into the weekend. More important data lies ahead in the coming days.
Sentiment Sours as Inflation Fears Linger

Source: Bloomberg
Consumer Loan Trends Worsening
Inflation is not the only threat to consumers’ health right now. Last Tuesday, the New York Federal Reserve issued its quarterly review of household finances. According to the report, total household debt reached $17.29 trillion in Q3, driven higher by mortgage, credit card, and student loan borrowing increases.
Of course, Americans’ cumulative assets are also essentially at all-time highs, so focusing solely on the debt side of the ledger is a myopic approach. Nevertheless, there’s a clear uptick in aggregate delinquencies among newly-issued debt. The NY Fed confirmed that 3% of all outstanding debt is in some stage of delinquency as of the end of September, with credit card default trends looking the worst as normalization back to prepandemic levels continues.
There are two ways to view rising credit card usage. Maybe the most intuitive is that families’ economic situations must be in bad shape if they are forced to spend more via credit. The optimistic view is that people must be confident enough with their money and job security to swipe away with credit cards.
Consider that Q3’s strong 4.9% real GDP rise was largely driven by high spending – so we wouldn’t have the growth we did without this kind of consumer activity. Bills eventually come due, though, and the loan delinquency trends cast a cloud on the consumer heading into the heart of the holiday shopping season.
Signs of a Weakening Consumer Help the Inflation Situation
It was just 15 months ago when Fed Chair Powell warned that the pain from sharply rising interest rates was likely on the way for American households and businesses. There are inklings that his Jackson Hole message is finally turning into reality given such downbeat sentiment and deteriorating debt trends.
A cooling labor market also underscores what could become a soft patch in economic growth over the next several months. With that weakness come some positive developments on the inflation front.
A 3.9% unemployment rate and sequential GDP growth slowing from near 5% to, say, the 1-2% range would meet the qualifications for a soft landing – so long as inflation returns to trend. Goldman Sachs pointed out last week that CPI rates spanning both developed and emerging economies are moving in the right direction.
At home, the steep fall-off in retail gas prices, a multi-month low in used car pricing, and easing home value trends should all contribute to a soft October CPI print on Tuesday morning. Year-on-year Headline CPI is forecast to be 3.3%, while Core CPI at 4.1% would still be stubbornly above the Fed’s 2% target. It is one month at a time, though, and economists at Goldman Sachs forecast Core CPI to be 2.7% year-on-year by the end of 2024 with Core PCE (the Fed’s preferred gauge) printing 2.4% by then.
The Trend of Falling Inflation Rates Is Expected to Continue Through 2024
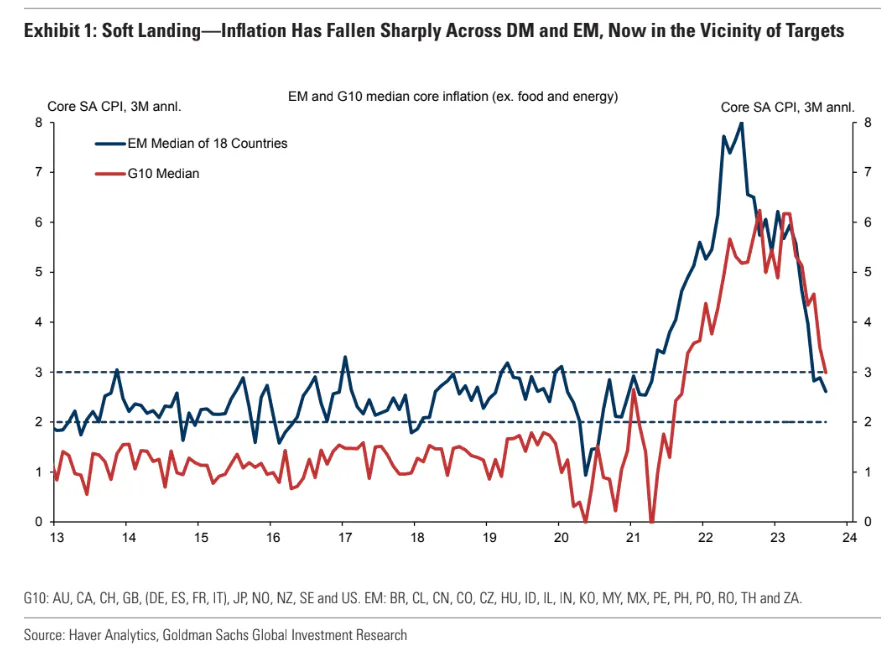
Source: Goldman Sachs
Wholesale Used-Vehicle Prices Decrease in October
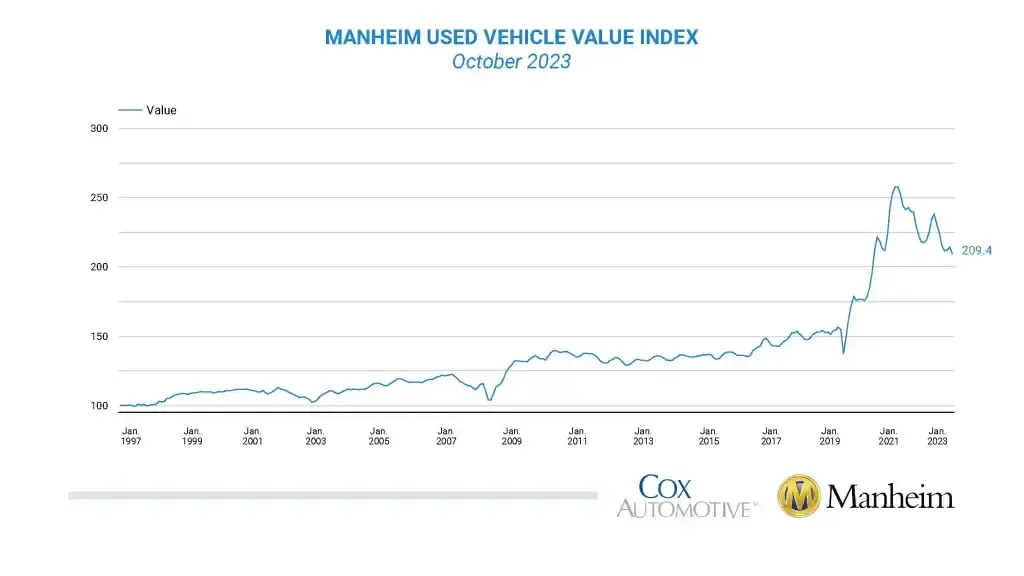
Source: Manheim by Cox Automotive
Retail Sales Growth Seen Slowing in October
CPI and PPI are no doubt critical to what the Fed might do next, but Wednesday’s Retail Sales report might hold the answer as to whether this past July marked the final rate hike. Consumer spending accounts for about 70% of the US economy, and each of the last three Retail Sales tallies have been downright hot. The September month-over-month growth rate was 0.7% which followed an upwardly revised 0.8% rise in August, well above the +0.3% forecast. Inflation accounts for just a portion of the increase while wage growth and increased debt-fueled consumption trends contributed to the Q3 spending boom. And we can’t leave out the Taylor Swift effect.
Looking ahead to this week’s report, BofA notes that total household card spending was down 0.5% year-on-year in October, leading their research team to forecast just a 0.1% rise in consumer spending. Meanwhile, Chase card data aggregated by J.P. Morgan suggests that the Control measure of Retail Sales likely increased by a still-strong 0.5% last month.
Lower Gas Prices, Weakening Travel Spending Should Contribute to Easing Retail Sales Growth
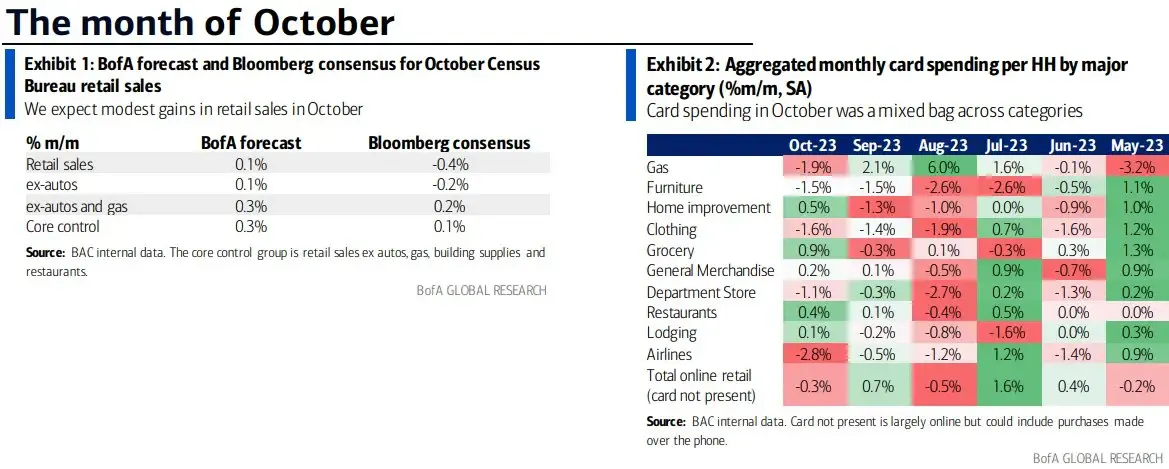
Source: BofA Global Research
The Fed Watch
If we get another big Retail Sales reading along with hot CPI and PPI prints, then the odds of a December or January rate hike would tick up. It would probably take this ‘triple play’ of inflationary data to make the Fed move. For now, the bond market is trading as if the Fed is done considering that the 10-year yield has been flat since the end of September and down significantly from the October 23 peak.
Are bond traders finally right? Is the Fed’s hiking campaign finished and are rate cuts on the way? We have seen this hopeful story before, and it has ended with the market succumbing to the Fed’s outlook in what some have dubbed a “cycle of death” whereby the market gets too hopeful about monetary policy loosening. As it stands, just a 23% chance of an additional rate increase is seen by market participants with four cuts discounted into 2024.
Last week we highlighted the possibility that the Fed might go too far with its mission to tame inflation. That notion is built on the reality that the FOMC’s biggest fear is letting inflation persist, tarnishing the legacies of the voting members and primarily Chair Powell. Would they be satisfied with a recession so long as CPI and PCE retreat to 2%? That may be the big unknown looking ahead, but we can be confident that pressure will come from all sides in the 2024 election year.
Keep Calm and Buy On? Investor Sentiment Soars.
With all these risks in play and unknowns out there, you’d think risk-on appetite would be tempered. That might not be the case. Consider that both the AAII Investor Sentiment Survey and a weekly poll of J.P. Morgan clients each revealed a spike in bullishness.
The AAII report featured one of the largest weekly rebounds in net bulls in years while JPM’s poll tallied a 1-year high in the percentage of investors planning to increase their equity exposure. Even with investment dollars pouring into the safety of money market funds, there is an apparent sense of ease. As for Allio, we have taken the opportunity to diversify risk through tech exposure, yes, but also by adding positions in US high-yield bonds and Chinese stocks.
Holiday Cheer Spreading Early This Season as Sentiment Turns More Upbeat
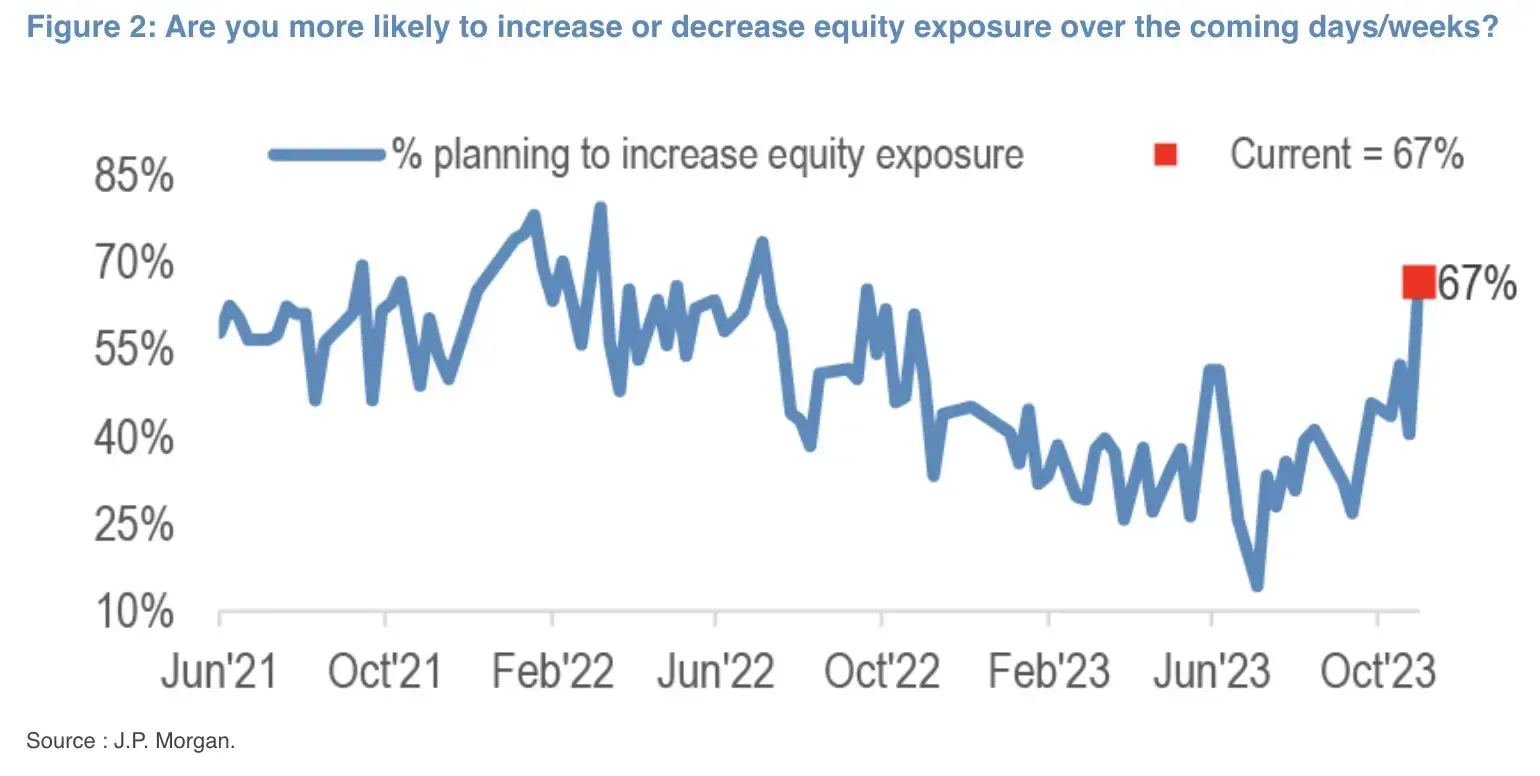
Source: J.P. Morgan
The Bottom Line
Mega-cap tech led the way last week while small caps were negative. Yields were rangebound as investors await key inflation and consumer data this week along with earnings from America’s biggest retailers. We’ll be watching how the macro landscape unfolds with an ear on more Fed Speak this week and an eye on the Biden-Xi meeting.
Want access to your own expert-managed investment portfolio? Download Allio in the app store today!
Related Articles


The articles and customer support materials available on this property by Allio are educational only and not investment or tax advice.
If not otherwise specified above, this page contains original content by Allio Advisors LLC. This content is for general informational purposes only.
The information provided should be used at your own risk.
The original content provided here by Allio should not be construed as personal financial planning, tax, or financial advice. Whether an article, FAQ, customer support collateral, or interactive calculator, all original content by Allio is only for general informational purposes.
While we do our utmost to present fair, accurate reporting and analysis, Allio offers no warranties about the accuracy or completeness of the information contained in the published articles. Please pay attention to the original publication date and last updated date of each article. Allio offers no guarantee that it will update its articles after the date they were posted with subsequent developments of any kind, including, but not limited to, any subsequent changes in the relevant laws and regulations.
Any links provided to other websites are offered as a matter of convenience and are not intended to imply that Allio or its writers endorse, sponsor, promote, and/or are affiliated with the owners of or participants in those sites, or endorses any information contained on those sites, unless expressly stated otherwise.
Allio may publish content that has been created by affiliated or unaffiliated contributors, who may include employees, other financial advisors, third-party authors who are paid a fee by Allio, or other parties. Unless otherwise noted, the content of such posts does not necessarily represent the actual views or opinions of Allio or any of its officers, directors, or employees. The opinions expressed by guest writers and/or article sources/interviewees are strictly their own and do not necessarily represent those of Allio.
For content involving investments or securities, you should know that investing in securities involves risks, and there is always the potential of losing money when you invest in securities. Before investing, consider your investment objectives and Allio's charges and expenses. Past performance does not guarantee future results, and the likelihood of investment outcomes are hypothetical in nature. This page is not an offer, solicitation of an offer, or advice to buy or sell securities in jurisdictions where Allio Advisors is not registered.
For content related to taxes, you should know that you should not rely on the information as tax advice. Articles or FAQs do not constitute a tax opinion and are not intended or written to be used, nor can they be used, by any taxpayer for the purpose of avoiding penalties that may be imposed on the taxpayer.