Updated January 16, 2024

Mike Zaccardi, CFA, CMT
Macro Money Monitor
Market Update
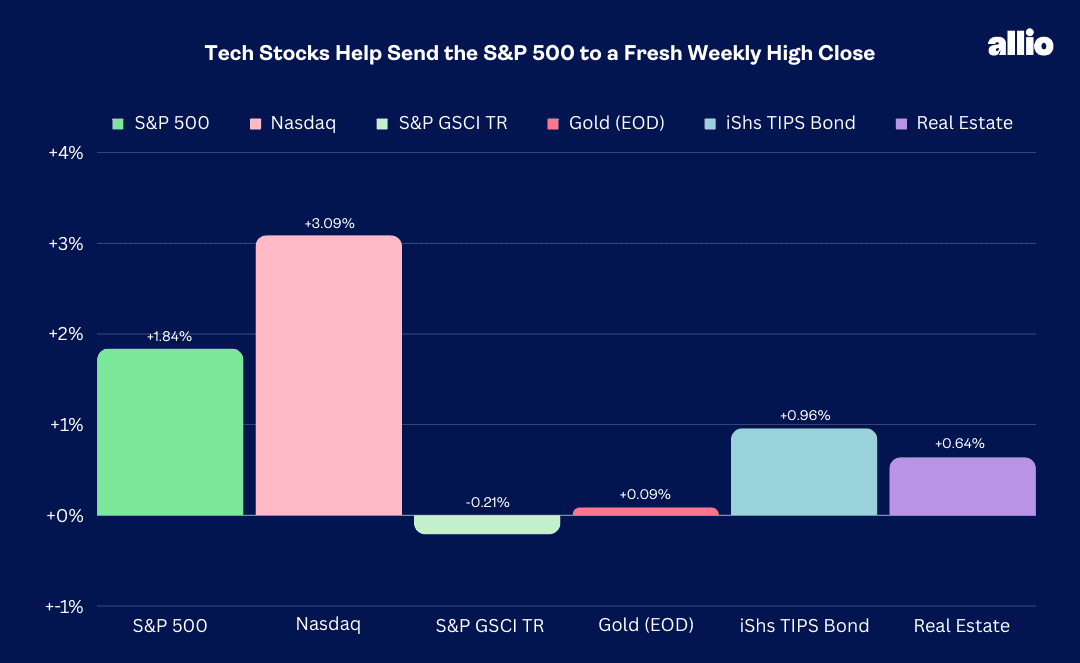
Large-cap tech led the S&P 500 to its 10th positive week out of the last 11 and an all-time weekly closing high. The SPX rallied just shy of 2% while the Nasdaq Composite, up each day last week, jumped more than 3%, tallied its best week since October. It was by no means green across the board, however, as four of the 11 sectors finished in the red, led by a significant 2.4% drop in Energy stocks.
Ongoing tensions in the Red Sea did little to lift the spot price of oil, though oil & gas names were among the top performers on Friday. What’s more, Utilities, which usually do well when interest rates decline, were down 2% during the first full trading week of 2024.
Elsewhere, Real Estate managed a modest advance while the bond market caught a significant amount of buying pressure. In-line CPI and deflation at the producer price level helped the aggregate fixed-income index, as well as TIPS, gain steam. Gold, like oil, rallied on Friday, but the precious metal posted just a fractional gain for the week.
Finally, it continues to be crickets across the broad commodity complex as the US Dollar Index drifts around the 102 mark. The only action seems to be in the natural gas market as old man winter tightens his grip on the central US.
For the year, the S&P 500 is up 0.3% and the Nasdaq Composite is off 0.3%.
January 5, 2024 - January 12, 2024
The Look Ahead
More December data is on tap. The employment situation remains decent, albeit with a slew of internal numbers suggesting a continued cooling of the labor market. The inflation story, so far, is on track as far as the Fed is concerned, too. The third part of the domestic macro trifecta comes this week: Retail Sales. The Census Bureau reports that dataset Wednesday morning, and economists expect a small pickup in consumer activity compared to November’s 0.3% headline advance. More important will be the Core Control group – that's expected to have dropped to +0.3% in December from November’s 0.4% rate of increase.
Before that, the holiday-shortened week kicks off with a look at Empire Manufacturing – the state of economic activity in the New York Fed region. That soft-data report should reveal yet another negative print. Then on Wednesday, along with Retail Sales, comes import price data, December Industrial Production, business inventories for November, and a January snapshot of the NAHB Housing Market Index. Housing Starts and Jobless Claims come Thursday along with a preliminary gauge of consumer sentiment via the University of Michigan Survey of Consumers report. Several FOMC members speak throughout the week as the World Economic Forum Annual Meeting 2024 in Davos takes place.
December Retail Sales, Industrial Production, and Housing Market Data are the Headlines
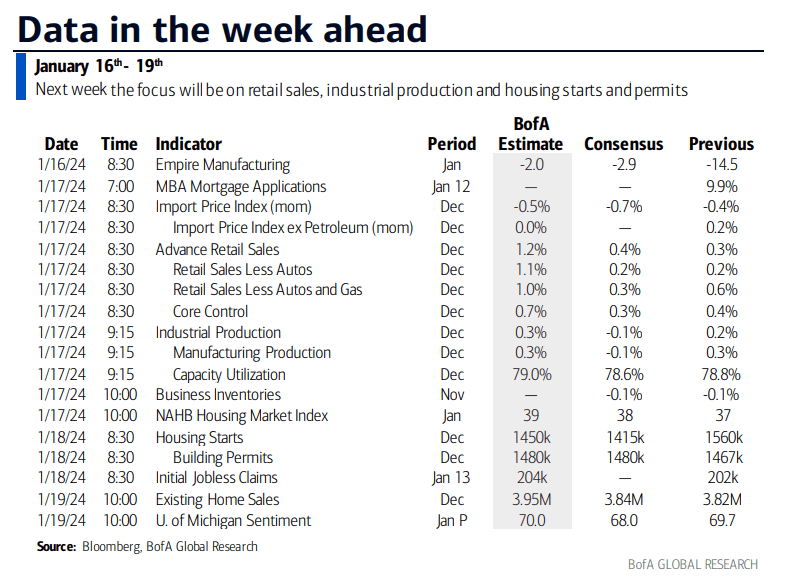
Source: BofA Global Research
Earnings Reports This Week
The early read on Q4 corporate earnings was mixed. JP Morgan (JPM) reported solid numbers, but Wells Fargo (WFC), Bank of America (BAC), and Citigroup (C) continue to battle their own issues. Shares of Delta (D) were about unchanged in the airline industry after it posted profit figures, but UnitedHealth Group (UNH), the biggest weight in the Dow, traded sharply lower post-earnings last Friday.
More companies from the Financials sector report this week along with several members of the Industrials space. We’ll see what executives at Morgan Stanley (MS) and Goldman Sachs (GS) have to say about capital markets Tuesday before the bell while Charles Schwab (SCHW) and US Bancorp (USB), a super-regional bank, report on other segments of the investment and banking arenas on Wednesday morning. Watch out for what Discover Financial Services (DFS) says the following afternoon for clues on the state of consumer borrowing. Then Taiwan Semiconductor (TSMC) offers a glimpse at chip demand – which could be particularly interesting in the wake of Taiwan’s elections over the weekend.
Back home, Truist (TFC) reports Q4 results Thursday morning along with other regional banks before PPG Industries (PPG), an Industrials bellwether, posts profits numbers Thursday night. More Financials sector companies report Friday along with Schlumberger (SLB) in the Energy patch.
Financials Earnings in Focus, Reports from TSMC and SLB Give Clues on the Semiconductor and Energy Markets

Source: Wall Street Horizon
Topic of the Week: What if ‘Immaculate Disinflation’ Falls Just Short?
Investing is often a game of expectations. Sometimes the riskiest times to be allocated to a stock-heavy portfolio are when economic indicators are solid and when overall sentiment is strong. All it takes is one exogenous event or minor hiccup in the data trend to get big portfolio managers to turn more cautious, particularly when valuations are on the high side.
Is that the scenario today? Not exactly. Consider that the trend in soft data, such as PMIs and many sentiment surveys, suggests investors and consumers are far from euphoric about the macro landscape. But with the S&P 500 now near 20 times earnings and after the late-year snapback in small caps, a decent amount of hope that inflation is yesterday’s concern is priced in.
CPI and PPI Review: Stocks Stride to New Highs
Last week, the December CPI report came in a touch to the warm side, driven up by the notoriously lagged shelter data. Stocks stumbled initially as fears indeed crept up that the trend in consumer prices was leveling off, and not continuing lower toward the Fed’s 2% target. Interest rates, however, trickled down after an initial spike on Thursday morning, suggesting all was well in the inflation world.
Headline and Core CPI Between 3% and 4%
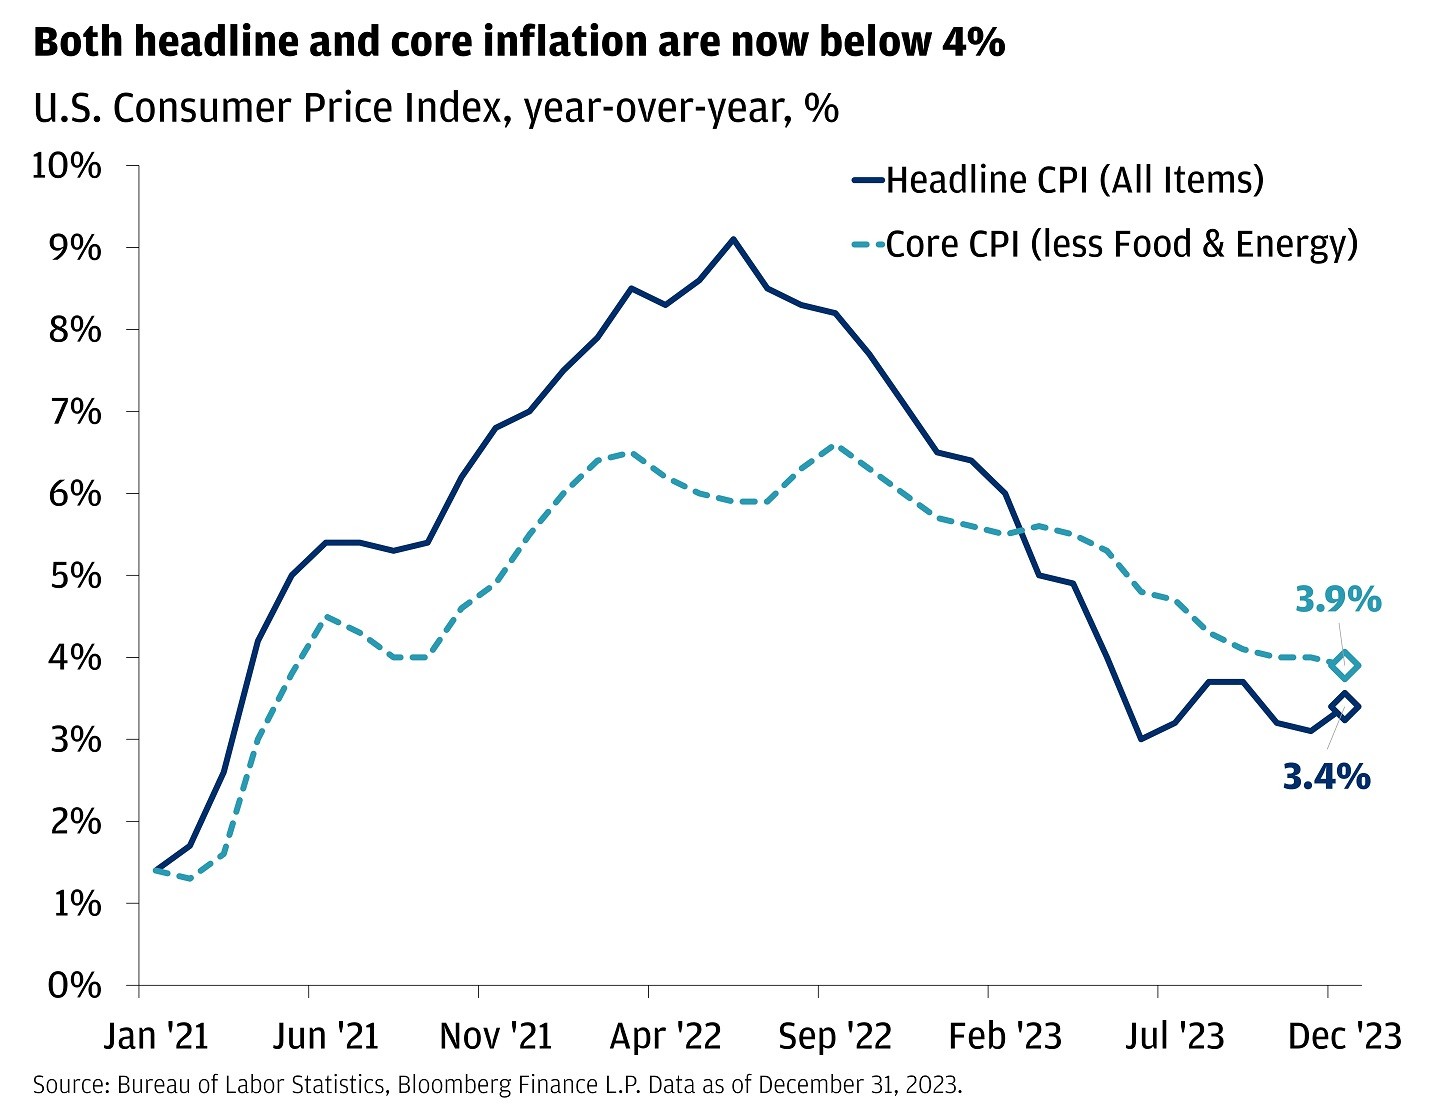
Source: JP Morgan
The more market-moving economic report came on Friday. The Producer Price Index (PPI) revealed a third-consecutive decline in wholesale prices. The PPI has become a more pivotal gauge as it feeds into the PCE inflation measure, which the Fed keeps a close watch on. Economists expect the next PCE report to show a continued positive trend lower, setting the stage for the beginning of an interest rate easing cycle.
US Headline PPI Falls for 3 Straight Months
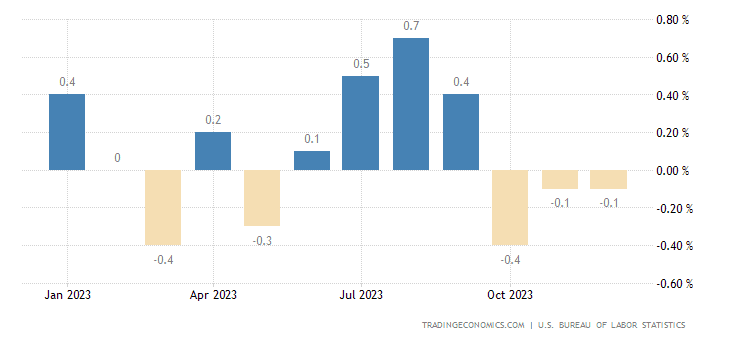
Source: Trading Economics
Keep the Cuts a Comin!
By the close last Friday, the Fed Funds futures market was more dovish than ever. The probability of a March rate cut had jumped to 77% and a total of 157 basis points of easing was priced into 2024. We have been outspoken about taking the CME FedWatch Tool’s probabilities with a hefty grain of salt, but week-to-week changes in both the near-term and longer-run interest rate expectations are indicators to at least be mindful of.
Last week’s developments point to a more sanguine outlook on both what the Fed might do and how stocks may perform (the S&P 500 made a new all-time weekly high close as deeper rate cuts get discounted). We must remind ourselves that there are still two CPI and PCE reports before the March meeting – a lot is to be determined.
Inflation Breakeven Rates Turn Higher in 2024, Remain Below the Q4 2023 Highs
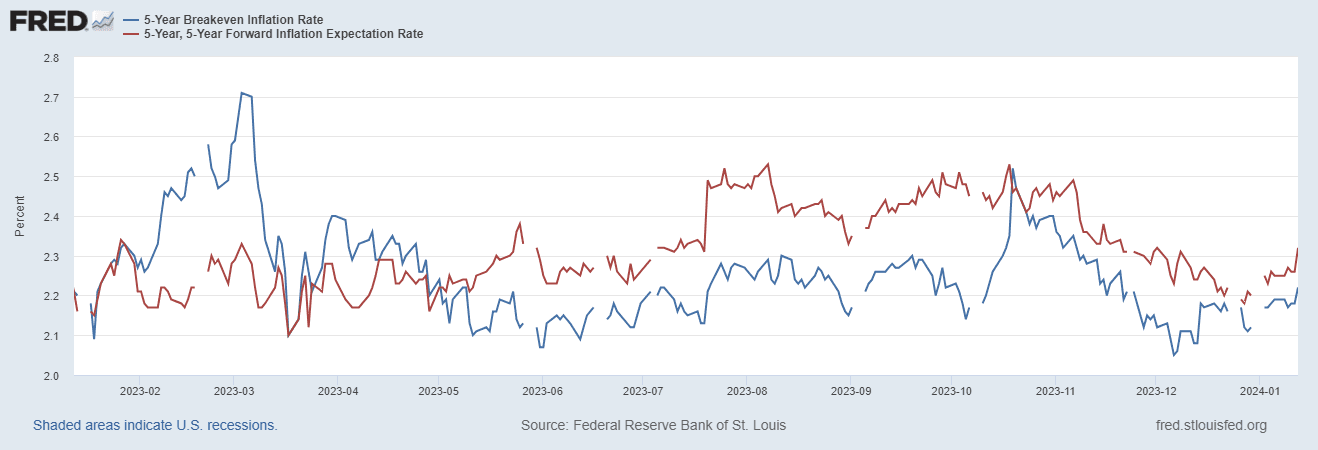
Source: St. Louis Federal Reserve
CEOs Rubbing Shoulders, Making Deals
The brewing optimism is not just a financial-market phenomenon. The first-quarter conference season is in full swing. The JP Morgan Health Care Conference, the Consumer Electronics Show, and the Goldman Sachs Energy & CleanTech event have already wrapped up. As corporate movers and shakers meet, they are undoubtedly talking consolidation and laying out capital allocation plans. M&A deals were inked in both the Health Care and Energy sectors to jumpstart 2024. With ever-growing signs of a friendlier environment for corporate borrowing, mergers, takeover deals, and IPOs could spring back to life over the ensuing quarters.
Inflation Remains In Play
Are investors and CEOs getting ahead of themselves, though? Is the inflation battle indeed won? Of course it’s possible, but markets are trading as if inflation is back at the Fed’s target for good. There appears to be little regard for the risk that pressures such as strong wage growth and elevated inflation in parts of the services side of the economy may keep CPI and PCE above the FOMC’s 2% target. Another scenario – economic expansion keeps defying economists’ expectations to the high side. This week’s Retail Sales report will shed light on the growth side of the ledger. The onslaught of Q4 earnings reports will also offer a read on growth. While not our base case, if real GDP comes in hot this quarter and next, it could mean significantly fewer Fed cuts this year.
BofA Forecasts a Hot December Retail Sales Report
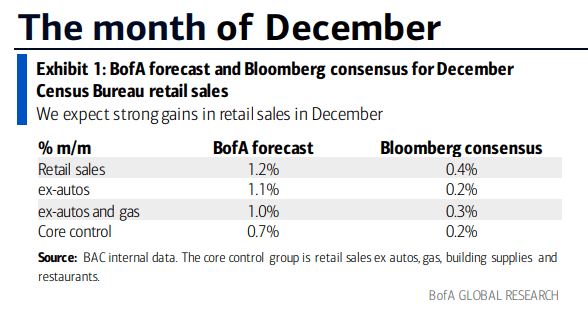
Source: BofA Global Research
Unsolved Inflation Mysteries
The bigger risk to us is that Headline and Core inflation turn sticky in the 2.5% to 3% zone. While that is by no means the kind of screaming rate of increase we all felt in 2022, maybe it’s even more troublesome as it could point to entrenched inflation, high enough for the Fed to keep its policy rate restrictive. Right now, the 5.32% effective Fed Funds rate is very tight if the six-month annualized Core PCE, under 2%, is correct. If, however, certain unresolved pieces of inflation remain stubbornly elevated, then the trip back to 2% may be short-lived.
What’s Priced In?
Stocks would not like that scenario given where valuations are today. It’s one thing if inflation fears exist when US large caps are priced 16 times earnings and small caps 11 times. Markets are three to four turns higher in valuation now, leaving little wiggle room for bad news. Indeed, the Goldilocks scenario appears priced in. Investors should keep a keen eye on what could disrupt that rosy path and, more importantly, what it could mean for stocks and bonds today.
Moving in Lockstep
Making matters trickier for those with diversified portfolios is that correlations between stocks and bonds reached a cycle high. All’s well when both equities and fixed income are in rally mode, as we enjoyed during the final nine weeks of 2023. When the music temporarily stops playing, though, sentiment can shift quickly, and a new defensive theme may emerge. How soon will that take place and to what extent will the magnitude be? Again, those are crystal-ball questions, but markets are venturing closer to a bearish seasonal stretch. Over the last few weeks, we have cautioned readers that after the usual bullish period around the turn of the year, Q1 of election years often feature bouts of volatility.
Correlations Reach New Highs
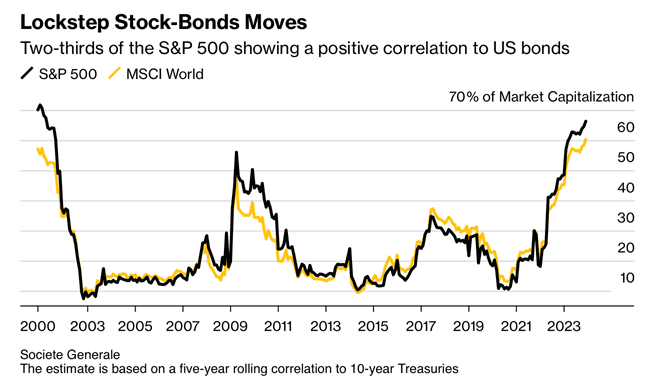
Source: Societe Generale
Clues from the 2-Year
We must give the bond market its due respect. Last week, the yield on the 2-year Treasury note fell to its lowest level since May 15, 2023. It’s often said that the FOMC merely chases what the 2-year rate is doing. With more than a full percentage point fall from its 5.26% peak back around the lows in the S&P 500 and Russell 2000 last October, fixed-income traders clearly expect continued cooling inflation and a friendly Fed. The 2-year is particularly important for firms that rely on short-term financing – lower borrowing costs allow companies the opportunity to access cheaper capital. This is among the most important charts to monitor right now.
The Bottom Line
The inflation narrative is optimistic at first blush. Short-run PCE inflation is at target while CPI and PPI trends are broadly in the Fed’s favor. With more than a handful of rate cuts on the horizon, investors are cheering the Fed on given that the S&P 500 rose to an all-time weekly high settle last Friday. Our concern is that inflation risk is not dead, and that unresolved inflation is an underpriced risk today. Keeping a close watch on macro trends for clues on whether immaculate disinflation falls just short will be important as Q1 rolls on.
Want access to your own expert-managed investment portfolio? Download Allio in the app store today!
Related Articles


The articles and customer support materials available on this property by Allio are educational only and not investment or tax advice.
If not otherwise specified above, this page contains original content by Allio Advisors LLC. This content is for general informational purposes only.
The information provided should be used at your own risk.
The original content provided here by Allio should not be construed as personal financial planning, tax, or financial advice. Whether an article, FAQ, customer support collateral, or interactive calculator, all original content by Allio is only for general informational purposes.
While we do our utmost to present fair, accurate reporting and analysis, Allio offers no warranties about the accuracy or completeness of the information contained in the published articles. Please pay attention to the original publication date and last updated date of each article. Allio offers no guarantee that it will update its articles after the date they were posted with subsequent developments of any kind, including, but not limited to, any subsequent changes in the relevant laws and regulations.
Any links provided to other websites are offered as a matter of convenience and are not intended to imply that Allio or its writers endorse, sponsor, promote, and/or are affiliated with the owners of or participants in those sites, or endorses any information contained on those sites, unless expressly stated otherwise.
Allio may publish content that has been created by affiliated or unaffiliated contributors, who may include employees, other financial advisors, third-party authors who are paid a fee by Allio, or other parties. Unless otherwise noted, the content of such posts does not necessarily represent the actual views or opinions of Allio or any of its officers, directors, or employees. The opinions expressed by guest writers and/or article sources/interviewees are strictly their own and do not necessarily represent those of Allio.
For content involving investments or securities, you should know that investing in securities involves risks, and there is always the potential of losing money when you invest in securities. Before investing, consider your investment objectives and Allio's charges and expenses. Past performance does not guarantee future results, and the likelihood of investment outcomes are hypothetical in nature. This page is not an offer, solicitation of an offer, or advice to buy or sell securities in jurisdictions where Allio Advisors is not registered.
For content related to taxes, you should know that you should not rely on the information as tax advice. Articles or FAQs do not constitute a tax opinion and are not intended or written to be used, nor can they be used, by any taxpayer for the purpose of avoiding penalties that may be imposed on the taxpayer.