Updated May 9, 2023

Raymond Micaletti, Ph.D.
Macro Money Monitor
Market Recap
Stocks inched lower last week amid plenty of earnings releases and economic data hitting the tape. The S&P 500 gave back just 0.1% while the NASDAQ Composite fell 0.4%. Volatility was seemingly non-existent with the VIX now lower in seven of the last eight sessions.
Commodities took it on the chin – the S&P GSCI Commodities Index lost 3.4% despite the US dollar not rallying much. That could be interpreted as a bearish cue for the global economy. Prompt-month oil has given back nearly all of its gains following the news more than two weeks ago that OPEC-Plus would be slashing production. Gold also encountered selling pressure as the yellow metal settled under $2000 per ounce.
Both the aggregate bond index and TIPS were fractionally down as yields crept higher last week. Hawkish Fed Speak kept a lid on the fixed-income market. Finally, the Real Estate sector caught a bid along with defensive Consumer Staples and Utilities last week - the group rose more than 1.5% in the face of climbing commercial real estate fears.

Earnings Update
Earnings season is in full swing on Wall Street. The numbers have come in decent thus far if you only look at the EPS beat rate. According to FactSet, 76% of S&P 500 companies have topped bottom-line estimates, but the revenue figures are not as rosy. Top-line beats are just 63% through week two, well below the 5-year average of 69%.
S&P 500 Companies Are Topping Reduced Earnings Expectations
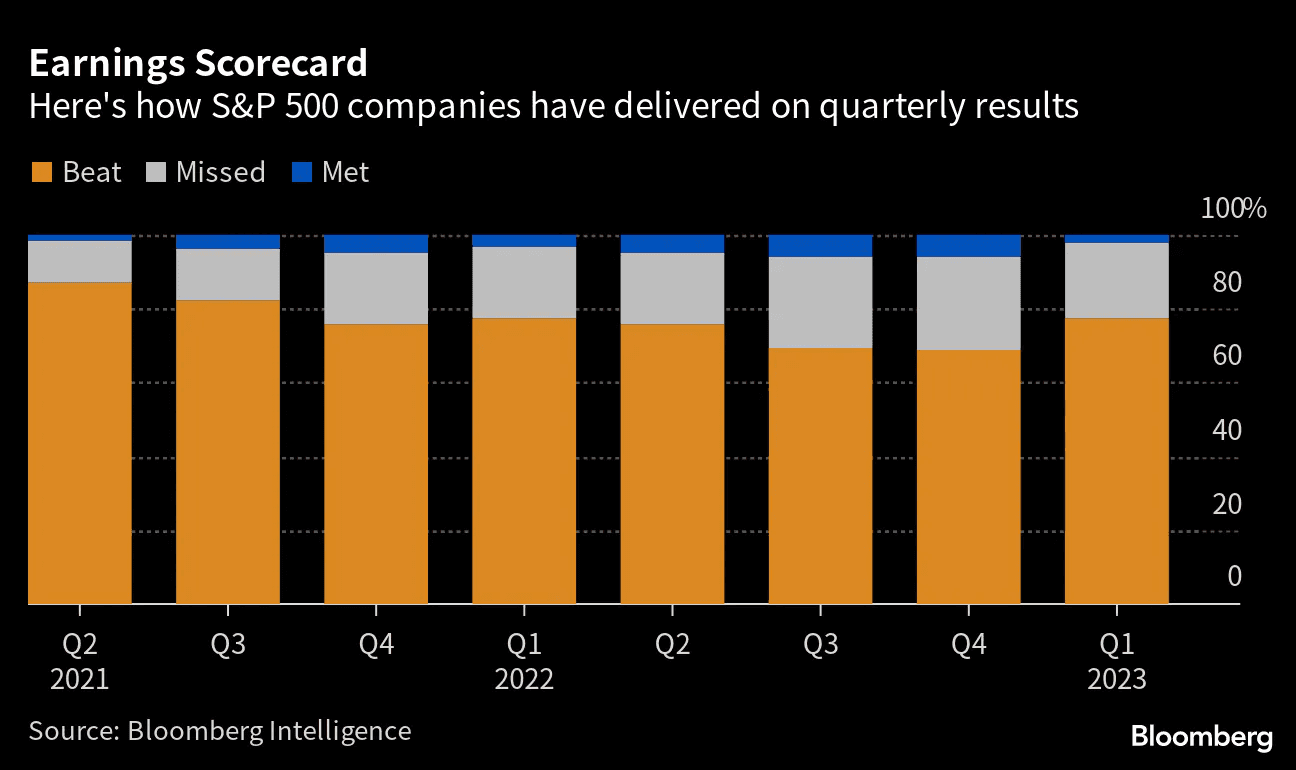
Source: Bloomberg
Also consider that per-share profit forecasts have come down massively from the peak in June of last year. Back then, analysts were expecting more than $250 of SPX EPS. Jump ahead to today, and that figure is barely hanging on to $220. So, it is really an expectations game.
But the real action is this week with 42% of the index issuing Q1 results – with many of the mega-cap tech stalwarts reporting. While Apple’s numbers don’t cross the wires until May 4, Microsoft, Alphabet, Amazon, and Meta all report from Tuesday afternoon through the after-hours on Thursday. We will know a lot more about the current read on corporate profitability as well as the outlook for the balance of the year once the week is out.
42% of the S&P 500’s Market Cap Reports Q1 Numbers This Week
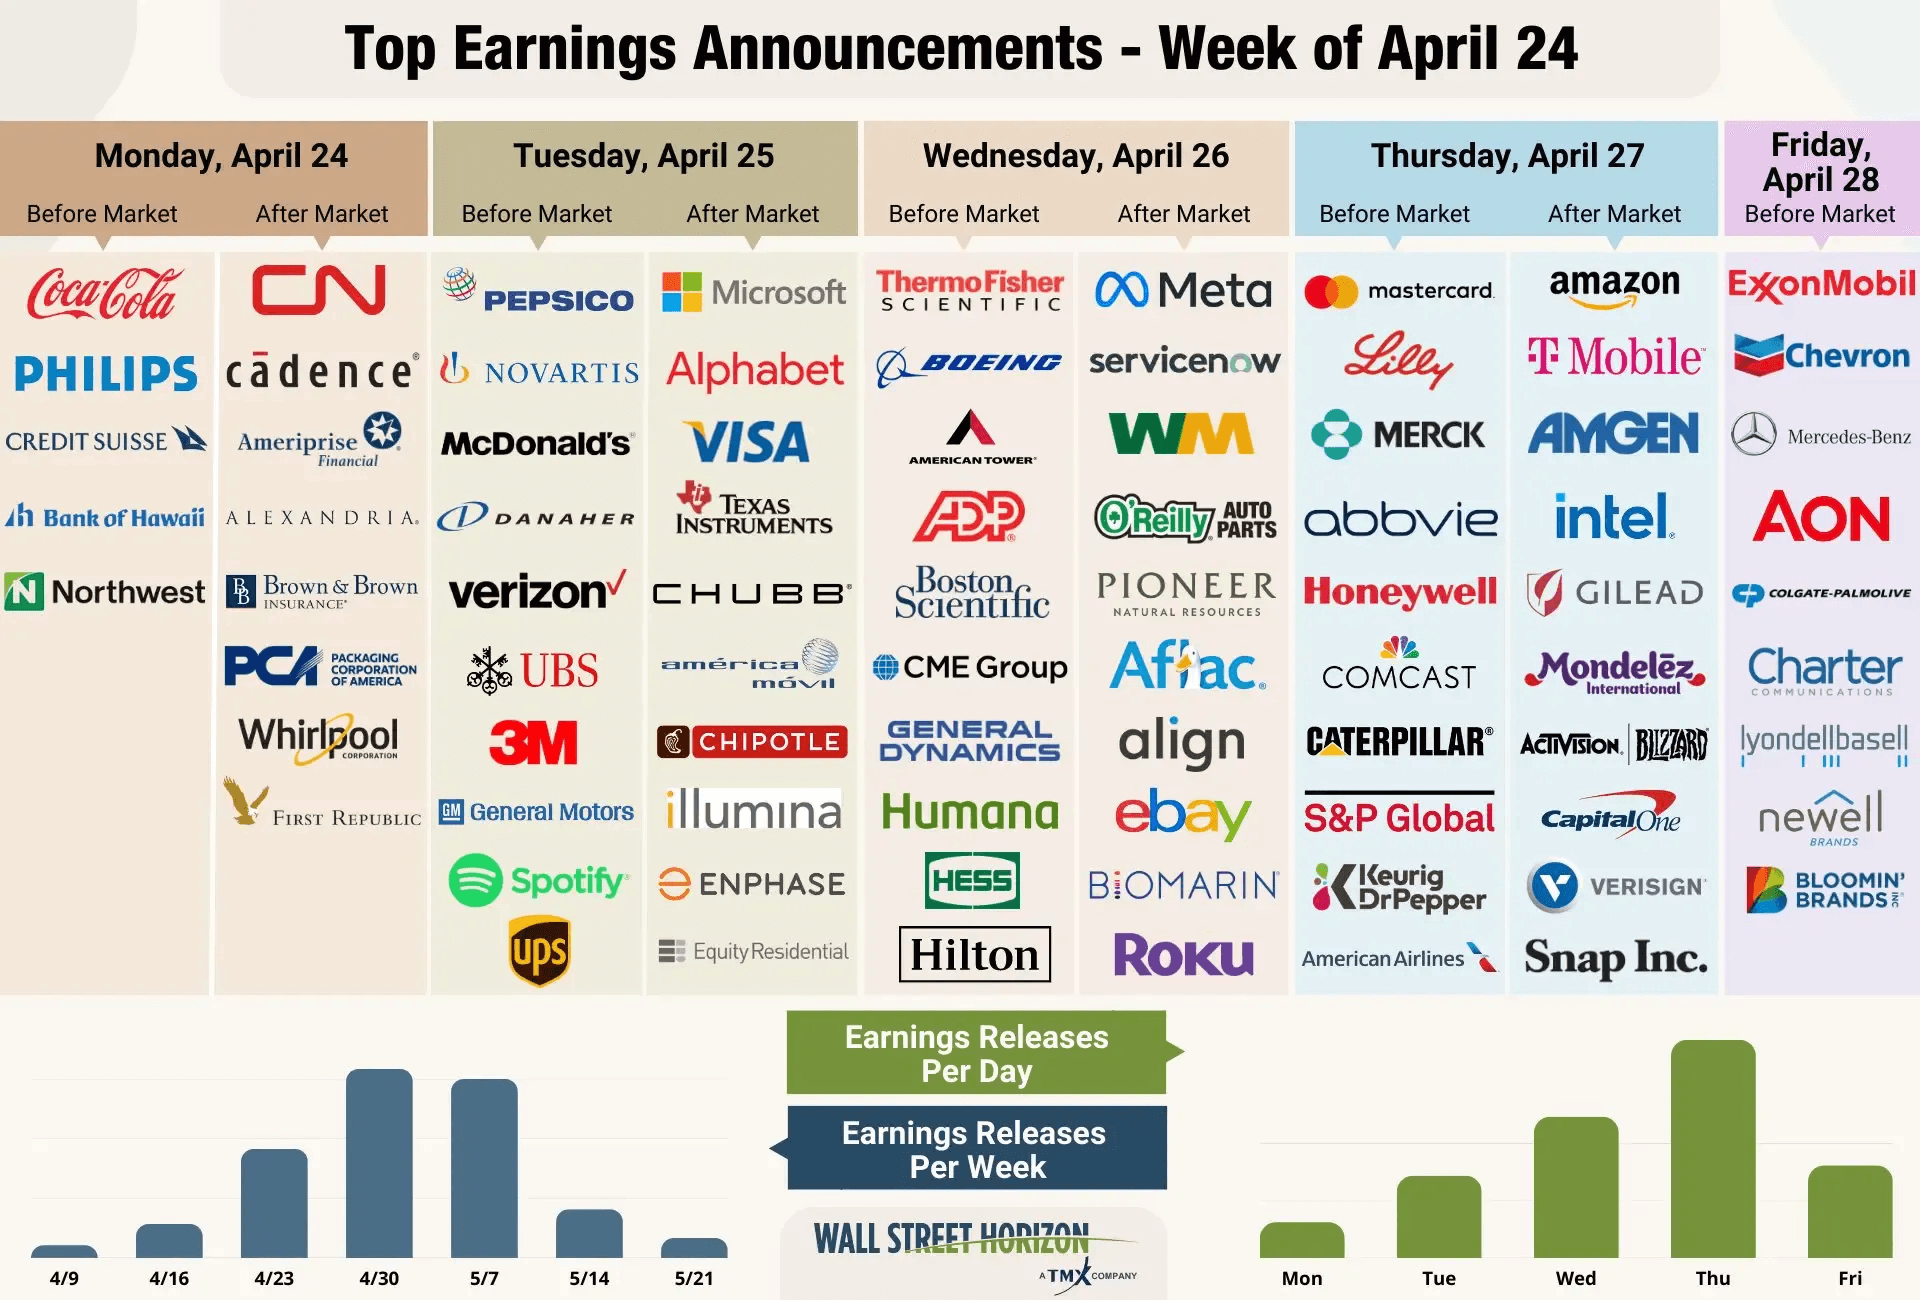
Source: Wall Street Horizon
A Fed Decision Looms
Strong earnings figures and optimistic outlooks are not what the Fed wants to see and hear. Just last week, there was a smattering of hawkish statements from a range of FOMC members ahead of their scheduled blackout period. The next meeting takes place on May 2-3 with a widely expected quarter-point hike announcement Wednesday afternoon next week. Assuming that’s the outcome, money market rates will be near to even slightly above 5% - that is a lofty hurdle for equities that already feature a muted equity risk premium (the lowest since the 2008 Great Financial Crisis).
The lone dove on the Fed committee is voting member Austin Goolsbee out of Chicago who voiced uncertainty about how recent credit events may impact financial markets going forward. But most of the FOMC members are in a state of groupthink – one member after another is paraded out to the public to address “stubborn” inflation that is “much too high.” (To quote a pair of Fed officials last week.)
Regional Banks: A Technical Health Checkup
With earnings season pressing on and in advance of what could be the final rate hike of the cycle, price action among the most susceptible stocks – regional banks – has been lackluster. Pay attention to how the regional bank ETF (KRE) performs on an absolute basis and relative to the broader market.
Since the SVB saga and domestic regional banking turmoil of early to mid-March, KRE has done a whole lot of nothing, all while the S&P 500 has rallied. That underperformance could be a harbinger of more troubles ahead. Often, once a crisis passes, a relief rally (which may include short covering) ensues with at least a portion of the crash being retraced. That has not been the case this time for cyclical regional bank equities. While mega-cap tech garners the spotlight this week, KRE remains a key indicator for the U.S. market.
Regional Banks Cannot Catch a Bid Despite a Rising S&P 500
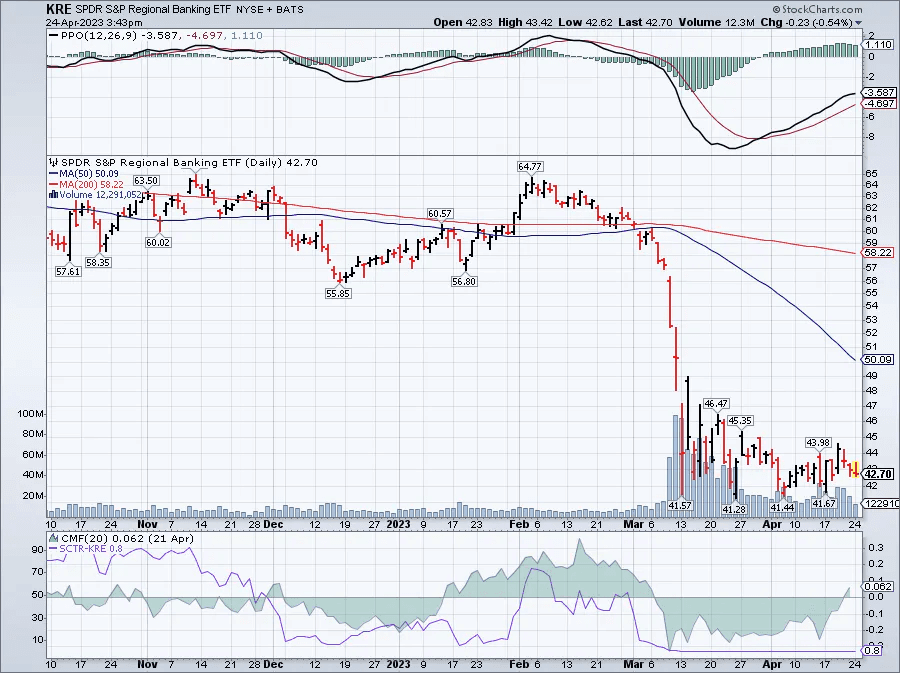
Source: Stockcharts.com
Option Expiration Passes By
Also stirring up potential volatility this week is simply market mechanics. Options expiration typically occurs on the afternoon of the third Friday of each month. That’s when options traders and other hedgers and speculators square up their portfolios and perform final delta hedging strategies.
Equities should be able to move about more freely this week without the constraints of OpEx looming. Three sessions last week featured an S&P 500 move of less than 0.1% - we haven’t seen that kind of lack of volatility since September 2019 and October 2017, according to Ryan Detrick of Carson Group. They say to “never short a dull market,” and while the SPX inched lower last week, we still assert that a melt-up period for markets is a very possible outcome over the next few weeks.
Options Expiration in the Rearview Mirror. The Focus Turns to Price Action in Stocks.
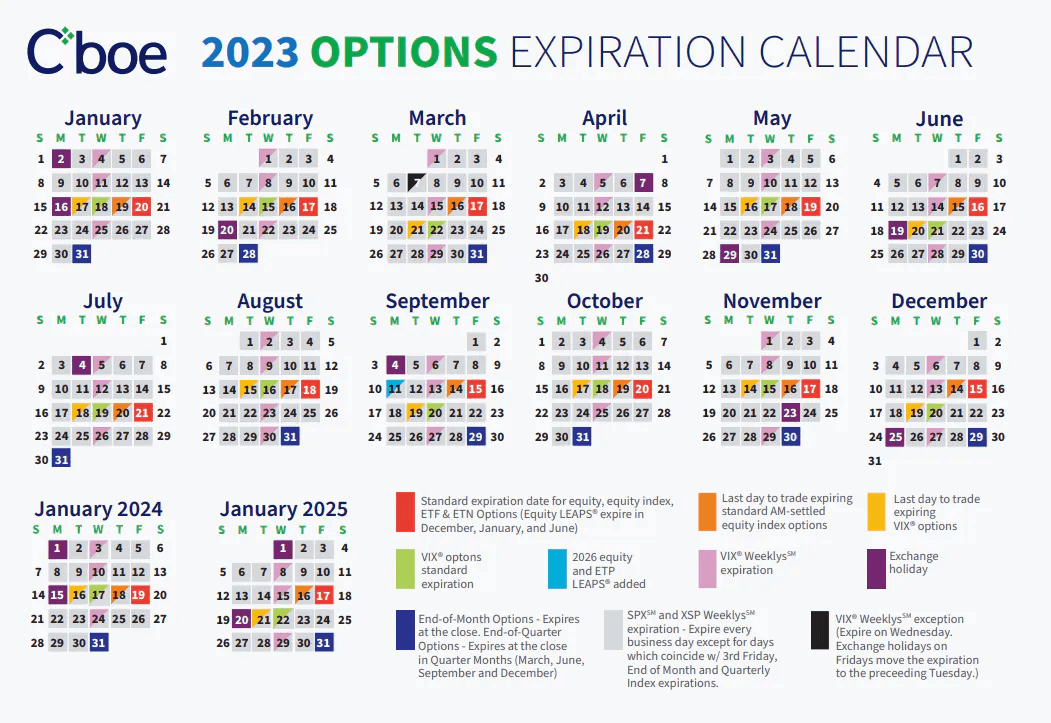
Source: CBOE
Volatility: Where Have You Gone?
The VIX is indeed quite depressed in the face of a flurry of major macro data and as earnings season reaches its zenith. What’s fascinating and perplexing to some is that realized volatility is actually lower than the already muted VIX index. Bear in mind that the VIX measures expected volatility on the S&P 500 by assessing the value of options going out 30 days.
The index settled last week under 17 – the lowest close in more than a year. But here’s the odd thing – realized volatility is under that. Thus, is implied vol too cheap here? Maybe not. Don’t discount the chance of summer doldrums keeping the VIX calm for an extended period.
Profit Margins at Risk
A key risk for stocks this earnings season and for the remainder of the year is the profit margin outlook. That is seen most clearly in the EV space today. Last week, Tesla shares fell big, down 11%. Elon Musk’s crown jewel was among the worst in the SPX as price cuts have led to a steep decline in the company’s net margin.
With intense competition from EV automakers and even domestic OEMs, the TSLA bears are back out in full force. After peaking above $217 in February, shares undercut their March low this past Thursday and Friday. Down about 25% from the YTD high, Meta now boasts a larger market cap than Tesla.
Spotting Technical Clues in the S&P 500 and Nasdaq 100 Relationship
Keeping our eyes on the tech(ish) landscape, we are monitoring technicals between the major indexes. One relative chart that has caught our eye is the movement between the S&P 500 ETF (SPY) and the Nasdaq 100 ETF (QQQ). The look has the hallmarks of a bear flag.
Notice in the graph below that when we plot SPY against QQQ, we find that the S&P 500 sharply outperformed from December 2021 through last year. There was a respite along the way with the tech-heavy Nasdaq 100 snapping back from late May through early August 2022. But a reversal took place around the turn of the year. Following a February consolidation, the new trend of larger degree (down), continued in March. We see a similar pattern today.
The clawback in S&P 500 stocks versus the Nasdaq 100 looks like another corrective pattern – that implies an impulse wave lower is the odds-on outcome. Just something to monitor as tech earnings plow in over the coming sessions. The implication is that the SPX may revert to more underperformance against the Nasdaq 100.
New 2023 Highs on the Doorstep?
For the SPX specifically, resistance continues just shy of the 4200 level. It made an approach to that key spot in early February before financial turmoil set in during March. While 3800 held as support and stocks did not fall below lows notched in December, the latest rally has lost some steam right underneath the YTD peak.
Could this week be the make-or-break moment for the market? That might be too dramatic considering the lack of volatility expected, but we cannot ignore this obvious resistance level on the chart as we head into the sometimes-dicey May through early October period on the calendar.
Economic Data Has Been ‘Less Hot’ Lately
This week’s Macro Money Monitor has been heavy on the technicals, which we believe play a crucial role in the near-term performance of markets, but we can’t look past the slew of economic data that has hit the tape over the last week plus. The undercurrent has been to the bearish side.
The Fed’s Beige Book of regional economic activity released last Wednesday suggested slowdowns in many areas of the country, particularly in tech-focused spots. But then Friday’s S&P Global US Manufacturing and Services PMI data – a preliminary look at April activity – revealed decent numbers that did not jibe with dismal March ISM data. That came after a contractionary Philly Fed Business Outlook and elevated jobless claims data on Thursday. In sum, economic surprises have not been so impressive, particularly if you back out the 11 consecutive headline beats in the monthly jobs report. The Citigroup Economic Surprise Index is falling back from its 2023 highs, indicative of less sanguine data.
Economic Data Turning Out Less Strong in Recent Weeks
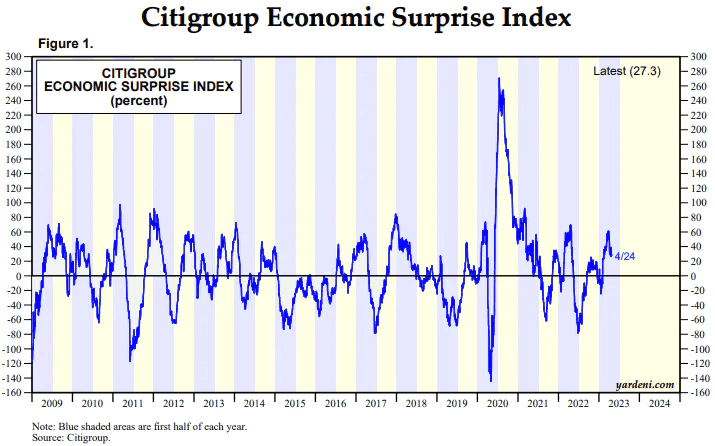
Source: Yardeni Research
The Bottom Line
We expect the bulls and bears to continue to duke it out for control of the market in an unprecedented slugfest not seen in quite some time. Bulls should win in the near term pushing stocks a bit higher on the back of decent (though waning) momentum and a general wall of worry held firm by the bears. Favorable seasonal trends turn more mixed in the weeks ahead, but pre-election year strength is something to be acknowledged and respected. All eyes are on the corporate earnings situation this week before the Fed steals the show next week.
Want access to your own expert-managed investment portfolio? Download Allio in the app store today!
Related Articles


The articles and customer support materials available on this property by Allio are educational only and not investment or tax advice.
If not otherwise specified above, this page contains original content by Allio Advisors LLC. This content is for general informational purposes only.
The information provided should be used at your own risk.
The original content provided here by Allio should not be construed as personal financial planning, tax, or financial advice. Whether an article, FAQ, customer support collateral, or interactive calculator, all original content by Allio is only for general informational purposes.
While we do our utmost to present fair, accurate reporting and analysis, Allio offers no warranties about the accuracy or completeness of the information contained in the published articles. Please pay attention to the original publication date and last updated date of each article. Allio offers no guarantee that it will update its articles after the date they were posted with subsequent developments of any kind, including, but not limited to, any subsequent changes in the relevant laws and regulations.
Any links provided to other websites are offered as a matter of convenience and are not intended to imply that Allio or its writers endorse, sponsor, promote, and/or are affiliated with the owners of or participants in those sites, or endorses any information contained on those sites, unless expressly stated otherwise.
Allio may publish content that has been created by affiliated or unaffiliated contributors, who may include employees, other financial advisors, third-party authors who are paid a fee by Allio, or other parties. Unless otherwise noted, the content of such posts does not necessarily represent the actual views or opinions of Allio or any of its officers, directors, or employees. The opinions expressed by guest writers and/or article sources/interviewees are strictly their own and do not necessarily represent those of Allio.
For content involving investments or securities, you should know that investing in securities involves risks, and there is always the potential of losing money when you invest in securities. Before investing, consider your investment objectives and Allio's charges and expenses. Past performance does not guarantee future results, and the likelihood of investment outcomes are hypothetical in nature. This page is not an offer, solicitation of an offer, or advice to buy or sell securities in jurisdictions where Allio Advisors is not registered.
For content related to taxes, you should know that you should not rely on the information as tax advice. Articles or FAQs do not constitute a tax opinion and are not intended or written to be used, nor can they be used, by any taxpayer for the purpose of avoiding penalties that may be imposed on the taxpayer.