Updated July 18, 2023

Raymond Micaletti, Ph.D.
Macro Money Monitor
Market Recap
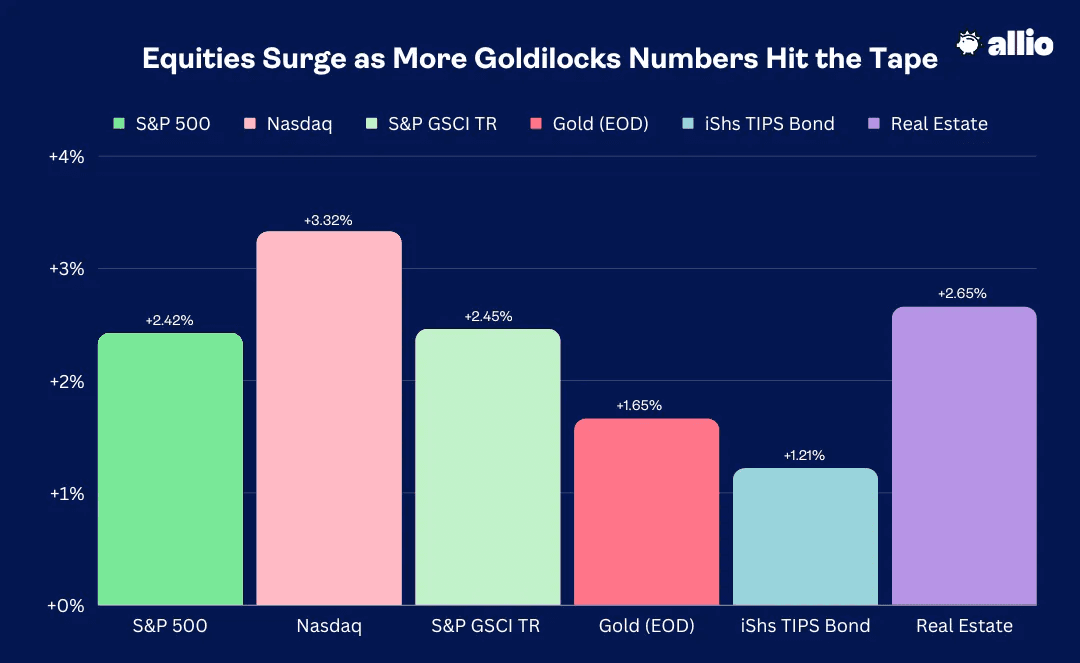
Stocks continued to melt up last week. The S&P 500 rose 2.4% while the NASDAQ Composite notched a 3.3% advance. Real Estate, the leading sector from the previous week, staged another impressive climb of 2.7%. Commodities caught a bid, up on par with the SPX’s gain, care of a much weaker US dollar. Gold was up, too, but the precious metal was not as strong as other more cyclically oriented raw materials. Finally, the bond market bounced back as interest rates dipped from their multi-month highs – the TIPS ETF rose 1.2%.

July 7, 2023 - July 14, 2023
Stocks Snap Back After a Soft Start to the Second Half
The bears are in summer hibernation. Equities across the board from large caps to small caps, foreign and domestic, value and growth, all seem to be participating in what has become a melt higher of sorts. Economists, meanwhile, are pulling back their outlooks for severe dips in economic growth. This more sanguine situation comes as a bevy of hopeful data points has been music to the bulls’ ears. We have a lot to get to on the macro front, so let’s dig in to find some key trends impacting markets and your money.
Inflation Fading
The big news last week was tamer than expected June CPI data. The year-on-year Headline rate came in at 3.0% (2.97% unrounded), which was more than 0.1% below the consensus estimate and the weakest rate since March 2021. Core CPI (stripping out food and energy) revealed a still-high 4.8% annual consumer price rise, but it was the lowest figure since late 2021.
For June itself, Headline CPI’s change was +0.18%, also softer than expected, marking the weakest monthly Core rate since February 2021. US Real Average Weekly Earnings are now positive on a yearly basis, helping to mitigate a depletion in consumers’ excess savings that had built up during the pandemic.
Soft June CPI Data Ushers In Lower Treasury Yields, Higher Stock Prices

Source: Bloomberg, Christian Fromhertz
Interest rates dropped following that cool inflation read. The US 2-year Treasury yield dipped from 4.85% to just above 4.7% as investors felt consumer price trends were improving enough for the Fed to ease off on its rate hiking cycle. But there was more important data on tap.
The Employment Market Remains Tight
We continue to monitor trends in the weekly Jobless Claims report. On the 13th, the Labor Department announced a lighter-than-forecast figure while Continuing Claims were not far from expectations. This built on strong job market trends seen in the previous week that we delved into last time.
If we take a step back and assess the employment and inflation pictures together, we see clearer signs that a soft landing, for now, is in the cards. Consider that the June official payrolls report, though weaker than expected at the headline level, was still robust, Challenger Gray job cuts were modest, ADP Payrolls were solid, and Jobless Claims trends do not show any indication of a steady incline.
It’s Not Just CPI on the Mend
On the inflation front, CPI has been verifying below expectations, ISM Prices Paid subindexes show falling prices among purchasing manager surveys, and more good news came late last week.
While CPI often gets most of the buzz, the Producer Price Index (PPI) can be a harbinger of price trends since it can hit first before trends trickle down to the consumer level. June PPI likewise was under consensus estimates, reaffirming the broader trend.
Then came import and export prices—usually flying under the radar—which highlighted more encouraging news as import costs fell in June after a steep drop in May. Import prices are now down 6.1% on an annual basis, the lowest since May 2020, while export costs are off 12% from a year ago, the lowest percentage change on record.
Are Folks Feeling Too Good?
A source of possible trouble could lie not in the backward-looking data, but in where households believe inflation will go from here. We got a look at that via the University of Michigan Consumer Sentiment survey. July’s gauge, released last Friday morning, showed an uptick in year-ahead inflation expectations, up to 3.4% from 3.3%, steeply above the 3.1% forecast. What’s more, the long-run 5-10 year consumer outlook was a tad hot at 3.1%, too.
This is a key reading the Fed looks to when shaping its policy decision. In general, consumers are feeling more upbeat about the state of the economy as July’s preliminary consumer confidence figure came in at 72.6 versus expectations of just 65.5, the best level since September 2021. Countering the UMich’s inflation findings were weaker inflation expectations trends released earlier this month by the New York Federal Reserve.
We might just sidestep a recession this year if these light inflation figures persist and the labor market holds up. Recall it was a year ago when the domestic economy notched a “technical” recession, with US real GDP growth dipping for two consecutive quarters. While not an official “NBER” recession, the so-called “vibes-cession” was felt hard. Now, we appear to have the “Taylor Swift” economy in full swing (Philadelphia Federal Reserve credited T-Sweezy concerts for a bump in consumer demand last week).
University of Michigan Consumer Sentiment: Households Turning More Optimistic on the State of the Economy

Source: Trading Economics
What’s Baked In? At Least One More Rate Rise.
So, we have set the table. Now, can you smell what the Fed is cookin'? That’s the million-dollar question at the macro level. It’s clear that a rate hike of 25 basis points is on the menu for the July 26 meeting. There’s uncertainty, however, as to whether a second (and perhaps final) rate rise is warranted.
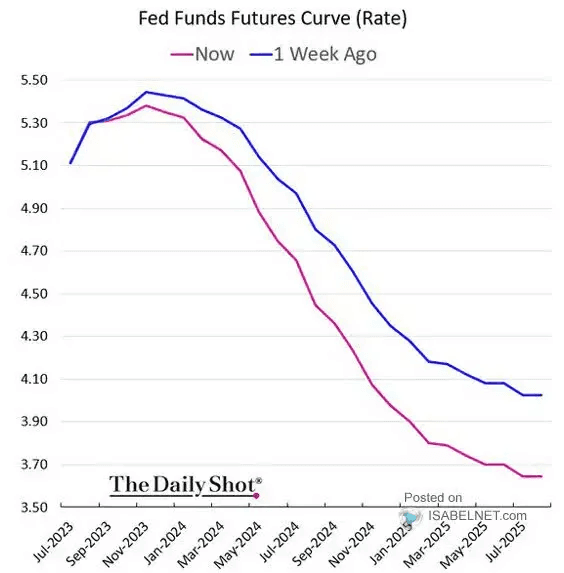
As it stands, following a large amount of labor market figures and a copious volume of consumer price data lately, the Fed Funds futures market shows a 60% probability of at least one more hike after this month. It is key for investors to look beyond just what the terminal rate will be, though. The overall futures curve indicates that the market sees a lower policy rate out to late 2024 and into 2025. Relative to earlier this month, additional rate cuts have been baked in thanks to mild inflation gauges.
More Rate Cuts Priced In For 2024 Care of Disinflation Trends

Source: The Daily Shot, ISABELNET.com
Key Macro News On the Way
Expect more movin’ and shakin’ this week when more June economic data crosses the wires. We’ll get key regional industrial activity reports (which include price and employment data) from the Empire Manufacturing report on Monday and Philadelphia Fed Business Outlook on Friday. Between those updates, Industrial Production hits on Tuesday while the key Retail Sales report comes Tuesday morning. Retail spending will be interesting in that the latest weekly Johnson Redbook report showed a year-on-year drop in retail sales for the first time since April 2020. Despite a healthy jobs market, consumer spending could be pressured in the second half.
Johnson Redbook: US Retail Sales Turn Negative from Year-Ago Levels Ahead of the Back-to-School Shopping Season

Source: Bloomberg, Johnson Redbook
Macro Spotlight: Dollar Drama
Along with the Leading Economic Index (LEI) report on Friday this week, we will get a slew of housing data that will move markets. Amid all that, it’s always key to pay attention to price action. For the first time in months, we are seeing meaningful moves in the US Dollar Index. Hinted at earlier, when the greenback drops, risky assets like stocks and commodities often do well. A lower dollar also benefits multinational corporations in that they can effectively sell more overseas as their products and services become cheaper on the international stage. Also, firms must repatriate earnings from abroad, and a weaker home currency results in higher profits per share.
The Dollar’s Impact on Markets
The “DXY,” as it’s known, settled at its lowest level since March last year as the euro, which makes up about 60% of the index, marched higher. Notice in the chart below that the USD spiked to its highest level since the early 2000s last September. Equities bottomed out shortly after. Technicals now suggest further downside ahead for the dollar, which would be a boon for stocks. Certain sectors, styles, and geographies could benefit more than others, though.
All else equal, we tend to see resource-heavy sectors such as Energy and Materials benefit from a turn lower in the greenback while value stocks and cyclicals could also exhibit relative strength. Lastly, don’t overlook foreign stocks during periods of a weaker dollar, particularly Emerging Markets. The longer the DXY dances below the psychologically important 100 mark, the more the media will talk up where to put your money in a weaker-dollar environment. As the Alpha blog reiterated last week, “So long as dollar relative sentiment remains bearish, we would expect risk assets to attract interest.”
Dollar Woes: US Dollar Index Falls Under 100, Weakest Since Q2 2022

Source: Stockcharts.com
Financial Conditions Loosen Up, Fed Prepares to Tighten
You might read all this and feel confused as to where the overall landscape stands. Between changes in interest rates, stock market valuations, ebbs and flows with the dollar, among other variables, it’s a lot to take in. There is a useful gauge we can look toward that sums it up, and the Fed keeps its eye on this barometer, too.
It’s called the Financial Conditions Index (FCI), and it is designed to capture the conditions of available credit, market liquidity, and other macro drivers. A higher value indicates tighter conditions, and that is what the Fed would like to see right now. Much to the FOMC’s dismay, the FCI is now at the lowest level since early last year. In general, the higher stocks go, the lower the dollar dips, and if rates continue to ease off highs notched earlier this month, then the Fed may have more work to do on the monetary policy tightening front.
Eyeing Late-Month Volatility After Key Earnings This Week
As for stock market price action, we continue to expect volatility to be somewhat tame until we get to late month. That’s when the bulk of the S&P 500 market cap reports Q2 results and when the Fed issues its rate decision (FOMC members are in their usual blackout window right now ahead of their gathering next week), and maybe more importantly, when Jay Powell takes the podium. That is also when we see liquidity drying up across markets, which is a bearish piece of evidence.
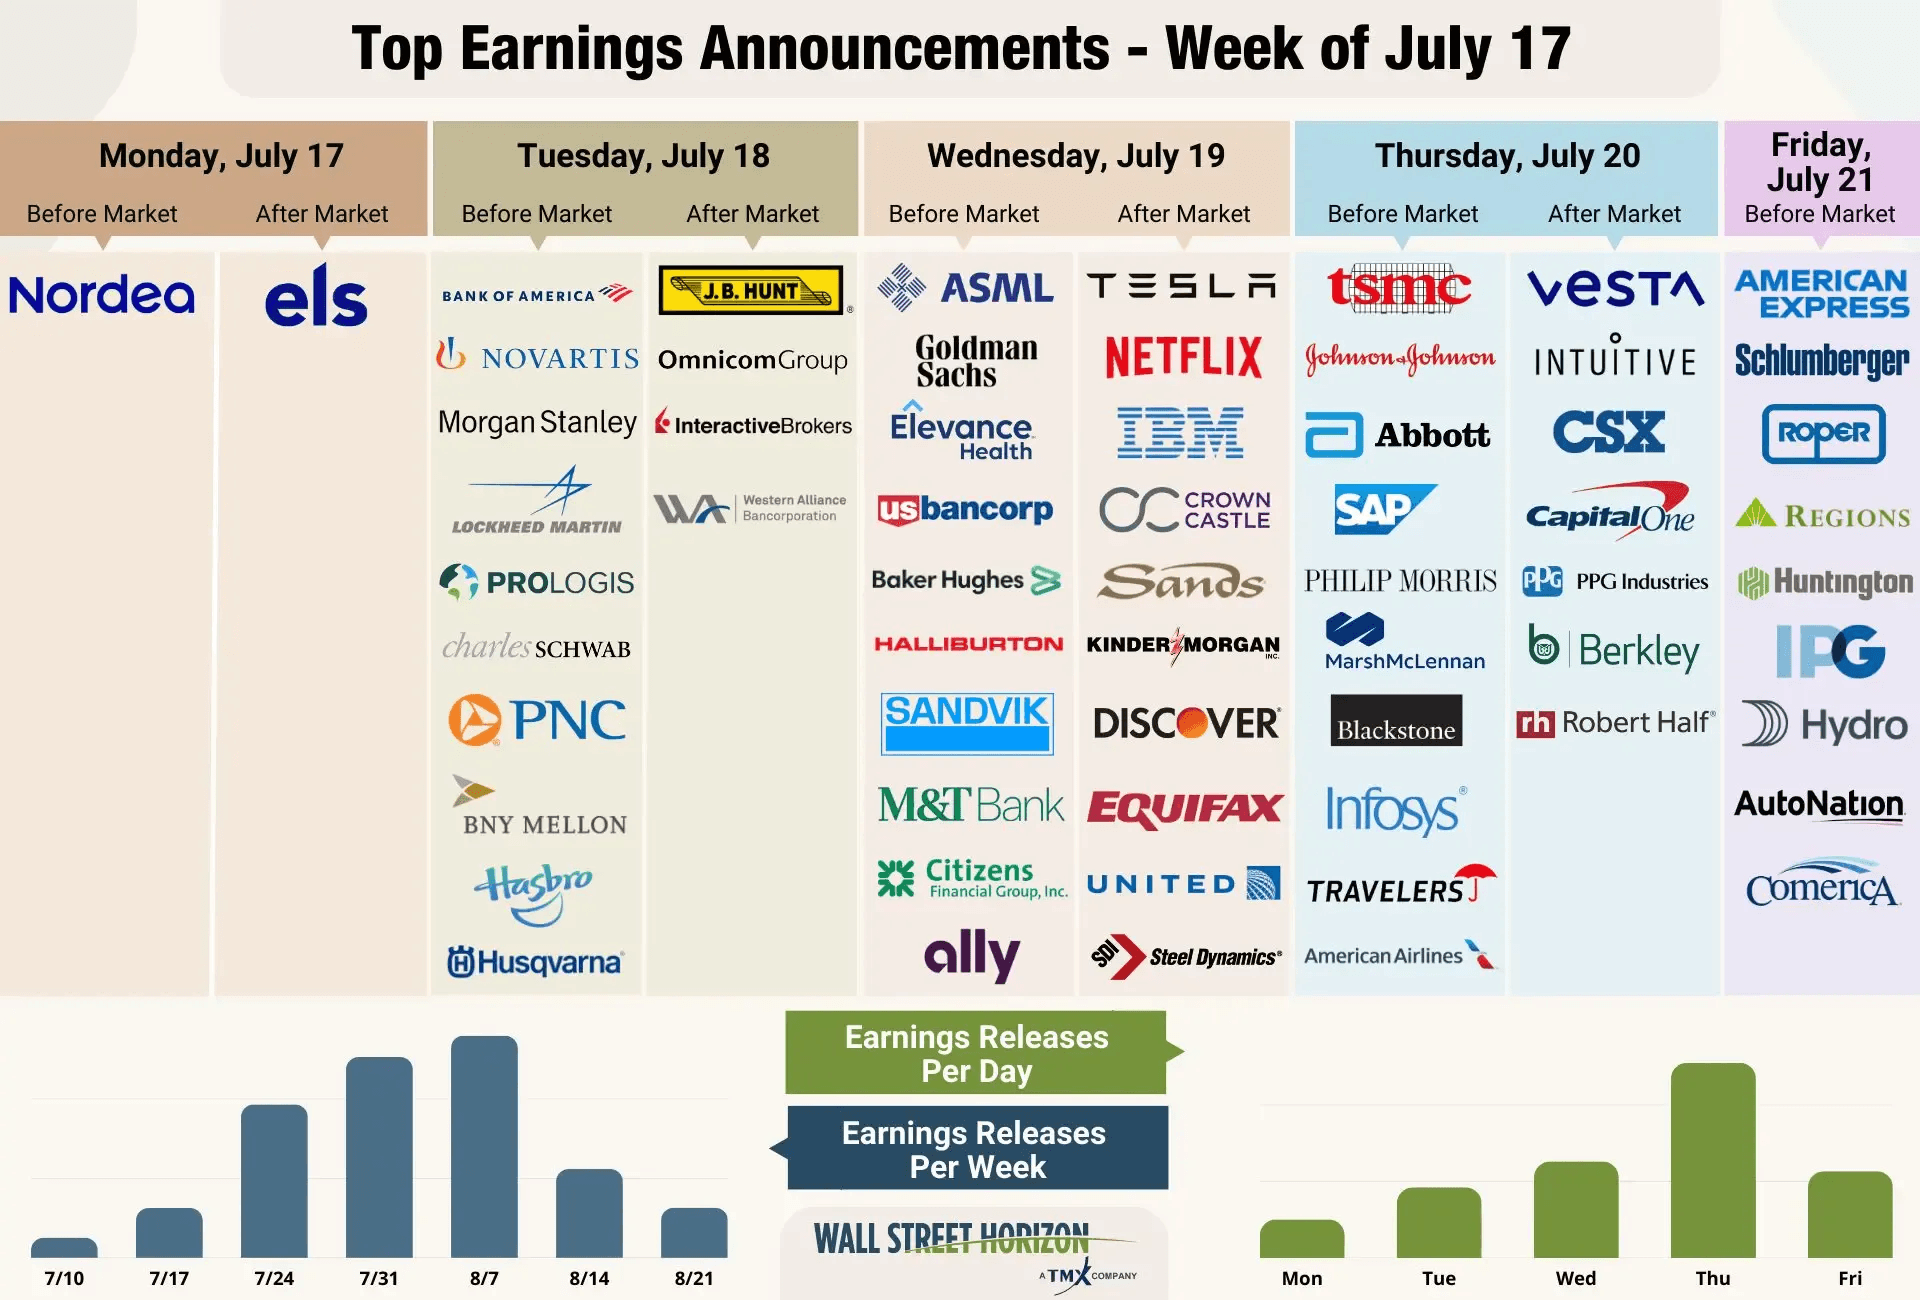
This week, though, corporate earnings hit fast and furious with many companies in the Financials and Consumer Discretionary sectors issuing results and offering up key outlooks for the second half.
Earnings On Tap This Week

Source: Wall Street Horizon
The Bottom Line
The bulls are soaking up the summer sun. Stocks ripped higher last week after a minor pause during the holiday-shortened first week of July. Since the start of June, the equity bull run has broadened out with small caps and cyclical sectors participating more than they had been over the first five months of 2023. The focus this week is on corporate earnings while the Fed takes center stage Wednesday next week along with mega-cap earnings capturing the spotlight later this month.
Want access to your own expert-managed investment portfolio? Download Allio in the app store today!
Related Articles
The articles and customer support materials available on this property by Allio are educational only and not investment or tax advice.
If not otherwise specified above, this page contains original content by Allio Advisors LLC. This content is for general informational purposes only.
The information provided should be used at your own risk.
The original content provided here by Allio should not be construed as personal financial planning, tax, or financial advice. Whether an article, FAQ, customer support collateral, or interactive calculator, all original content by Allio is only for general informational purposes.
While we do our utmost to present fair, accurate reporting and analysis, Allio offers no warranties about the accuracy or completeness of the information contained in the published articles. Please pay attention to the original publication date and last updated date of each article. Allio offers no guarantee that it will update its articles after the date they were posted with subsequent developments of any kind, including, but not limited to, any subsequent changes in the relevant laws and regulations.
Any links provided to other websites are offered as a matter of convenience and are not intended to imply that Allio or its writers endorse, sponsor, promote, and/or are affiliated with the owners of or participants in those sites, or endorses any information contained on those sites, unless expressly stated otherwise.
Allio may publish content that has been created by affiliated or unaffiliated contributors, who may include employees, other financial advisors, third-party authors who are paid a fee by Allio, or other parties. Unless otherwise noted, the content of such posts does not necessarily represent the actual views or opinions of Allio or any of its officers, directors, or employees. The opinions expressed by guest writers and/or article sources/interviewees are strictly their own and do not necessarily represent those of Allio.
For content involving investments or securities, you should know that investing in securities involves risks, and there is always the potential of losing money when you invest in securities. Before investing, consider your investment objectives and Allio's charges and expenses. Past performance does not guarantee future results, and the likelihood of investment outcomes are hypothetical in nature. This page is not an offer, solicitation of an offer, or advice to buy or sell securities in jurisdictions where Allio Advisors is not registered.
For content related to taxes, you should know that you should not rely on the information as tax advice. Articles or FAQs do not constitute a tax opinion and are not intended or written to be used, nor can they be used, by any taxpayer for the purpose of avoiding penalties that may be imposed on the taxpayer.


