Updated May 9, 2023

Raymond Micaletti, Ph.D.
Macro Money Monitor
Market Recap
Stocks were firmly lower intraweek following Wednesday’s Federal Reserve rate hike announcement and after mixed economic data, but a strong jobs report on Friday led to just a minor 0.8% decline in the S&P 500 to start the new month. The NASDAQ Composite eked out a fractional gain with Apple (AAPL) surging after its strong earnings report Thursday night.
Commodities sunk more than 3% care of a mid-week plunge in oil. Gold, however, bucked the trend to threaten its all-time highs – the yellow metal closed up by 1.3% for the week. The TIPS market was nearly unchanged along with the overall fixed-income space despite ongoing volatility in the bond market. Real Estate, meanwhile, gave back 0.8% but rallied Thursday and Friday.
And Now, Is the End Near?
Now that the 10th consecutive rate hike is in the books, traders have priced in a strong likelihood that the tightening cycle is in the books. When asked by a reporter if he had made any mistakes along the way, Chair Powell said, “I’ve had a few.”
Sure, we can point to the fact that the FOMC was oddly buying mortgage-backed securities during a housing market boom just two years ago and keeping rates anchored to zero percent amid an IPO and SPAC boom.
Today, though, the major Fed flaw might be hiking rates to decade-and-a-half highs in the face of regional banking turmoil. Many pundits suggested that the Fed take a wait-and-see approach at last week’s two-day meeting, but in yet another unanimous decision, an additional quarter-point hike took the policy rate to the 5% to 5.25% range, the highest in more than 15 years. As it stands, the market expects that to indeed be the end.
We see a “hike and pause” scenario being positive for certain equities. Tech stocks, in particular, may continue to benefit. There’s strong momentum with the Nasdaq 100 ETF (QQQ). The tech-heavy index fund settled at its highest level since mid-August on Cinco de Mayo, and investors in big tech surely enjoyed their margaritas all that much more after a volatile week.
The catalyst for the fresh rebound high was undoubtedly impressive results from the fund’s biggest weight: Apple. Strong numbers across the board (with expectations for softer Mac and iPad sales compared to a year ago) along with a doozy of a buyback announcement helped lift not just the QQQ ETF, but the broader market.
Nasdaq 100 ETF Closes At Fresh Highs Since August 2022
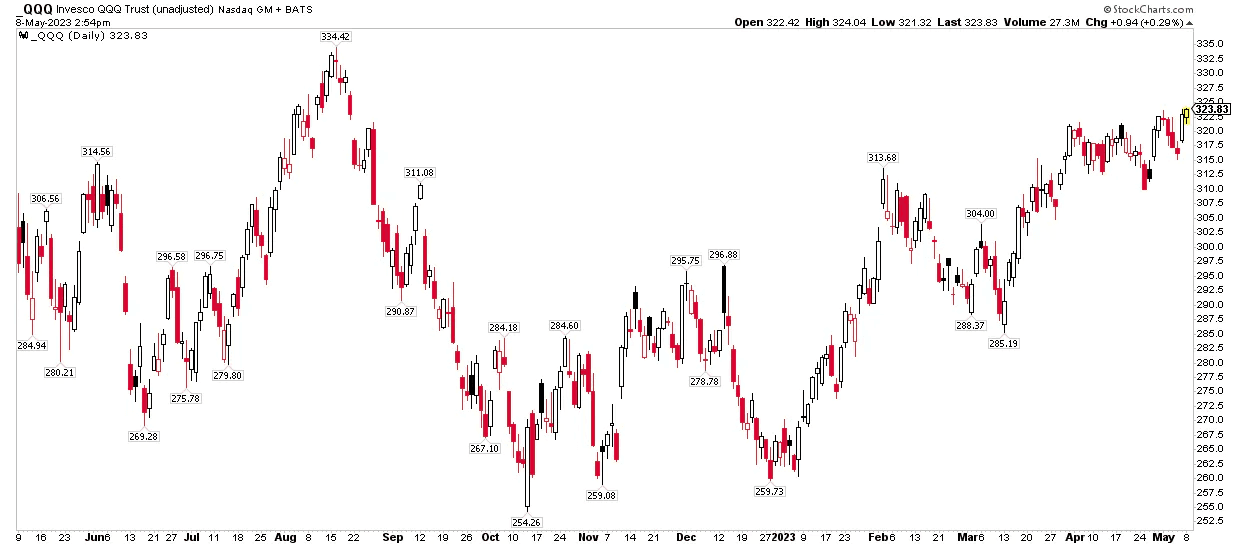
Source: Stockcharts.com
To give you a sense of how impactful the so-called “bank of Cupertino” is to the S&P 500, Apple’s 4.4% Friday advance was good for about 14 points of the SPX’s 75-point surge to cap off the week.
The largest stock in the tech sector is now a stunning 7.45% of the S&P 500. Even before the positive earnings reaction, Apple had staked its claim as the S&P 500’s biggest holding dating back to 1980, according to data gathered by Charlie Bilello.
If Tech Leads, QQQ and SPX Will Likely Outperform
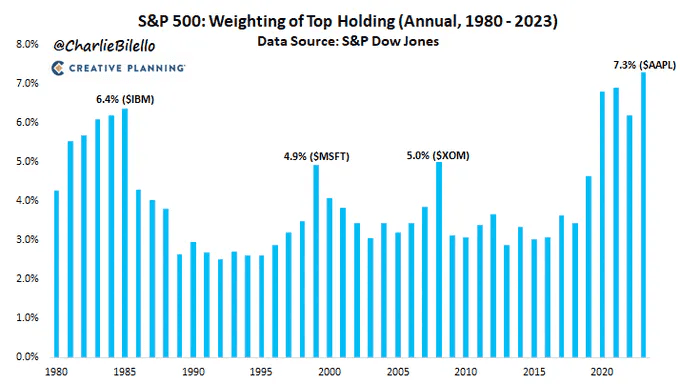
Source: Charlie Bilello
So, is it an all-clear then? Can we count on the world’s largest stocks to power markets higher during the notorious “sell in May and go away” period? While we don’t prescribe to that rhymey rule of thumb, we remain cautious on certain areas of the stock market. Before Friday’s euphoria - nearly the best single session for the S&P 500 since January - the regional banking crisis took another turn for the worse.
In March, Silicon Valley Bank (SIVB) and Signature Bank (SBNY) were put into FDIC receivership. Then over recent days, First Republic Bank (FRC) finally succumb to solvency risks as Jamie Dimon and JPMorgan Chase (JPM) had to come to the rescue. By the middle of last week, seemingly any financial institution based on the west coast was feared to have similar risks. Shares of PacWest (PACW) and Western Alliance (WAL) were caught in the center of the maelstrom.
Executives from those companies had to counter cascading investor fears with words of reassurance, underscoring that their companies were on sound footing. The statements were akin to what we heard in 2008. As shares in many regional banking stocks plunged mid-week, a short-covering rally on Friday was at least a temporary bank-sector reprieve.
Not helping matters for both banks and day traders is deteriorating overall liquidity. With a slowly shrinking Fed balance sheet and waning daily trading volume, equities just cannot seem to establish any kind of durable uptrend. While liquidity can be an obscure technical metric, it’s key to how stocks perform.
To illustrate the point, take a look at this chart from Fidelity Investments. There is a clear relationship between overall liquidity and the SPX. The last few weeks have us particularly concerned. There’s a divergence between liquidity and equities. Does that portend a rug-pull lower for the S&P 500? Hard to say with certainty, but this is a bearish factor to weigh when forming a macro outlook.
Overall Liquidity Purges to New Cycle Lows
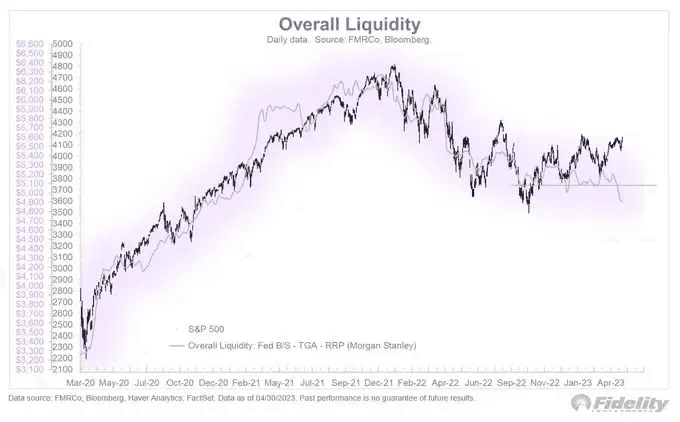
Source: FMR Co, Bloomberg
The Pain Trade
Amid a Q1 earnings season that has been better than feared, percolating regional banking troubles, and reduced liquidity, the feel of today’s market is one of bifurcation. Sentiment is awfully bad on down days, but then periodic upbeat news sends the bears scurrying.
Our view is that an extended pullback is not far away, but we continue to recognize momentum in growth stocks. The pain trade remains higher, but with the bulk of tech earnings in the rearview mirror, new bullish catalysts are needed to propel the SPX.
Stocks Generally Range-Bound Heading into the Summer
We also pay attention to clues on the chart. The S&P 500 has been in a range for the last several months between, call it, 3800 and 4200. With Friday’s jolt, we are near the top end of that zone. Can the bulls push the market to new heights? For more details on that, you’ll have to check in with our Alpha Blog to get specifics on our market outlook.
The SPX Range Trade
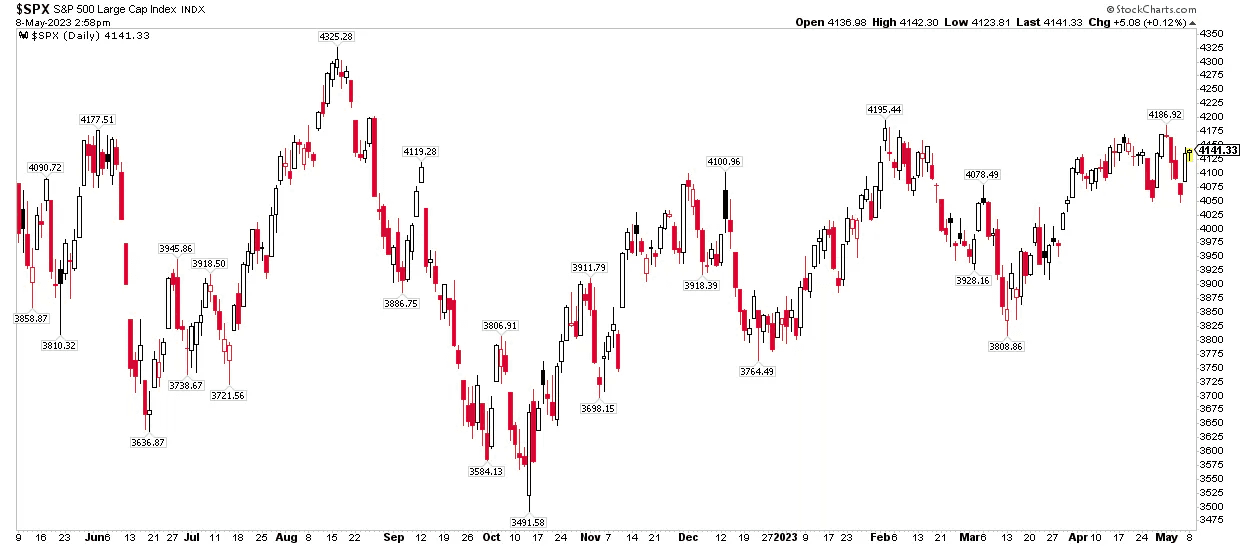
Source: Stockcharts.com
As for the macro, we’ll get impactful economic data mid-week with April CPI and PPI data. Be sure to put a star on your calendar for Wednesday morning when CPI hits. The consensus calls for a 0.4% month-over-month inflation climb with a +0.3% rise in Core CPI. Along with PPI Thursday, traders will get their first look at what consumer expectations are for inflation in Friday’s preliminary May University of Michigan Consumer Sentiment report.
Inflation Will be the Tale of the Economic Tape This Week
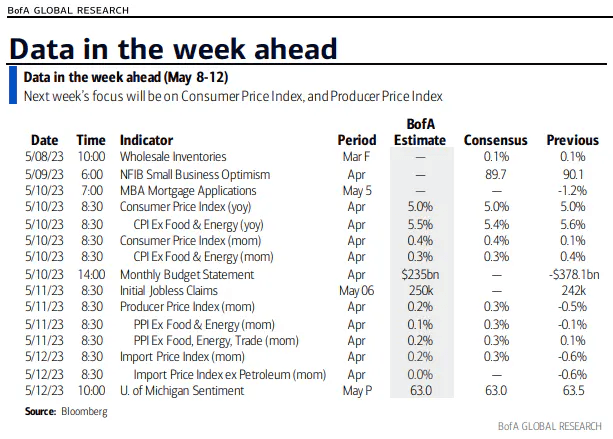
Source: BofA Global Research
Core CPI Expected to Remain Well Above the Fed’s Comfort Range
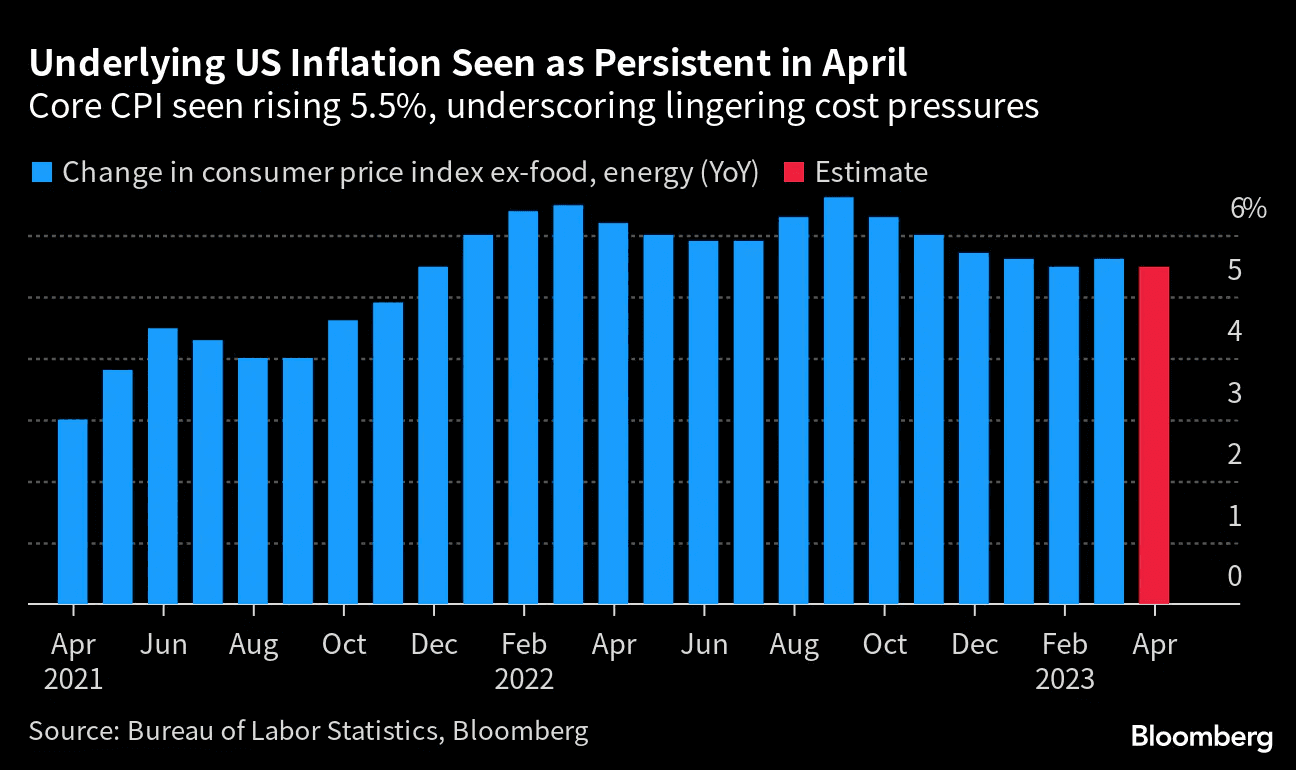
Source: Bloomberg
There’s still uncertainty about what the Fed might do in June. While the Fed Funds futures market shows just a 1-in-12 chance of an additional rate rise, if the April CPI reading comes in hot and consumers’ expectations are for elevated inflation, then the Fed Chief’s hands may be tied. We will also get the May payrolls report before the next FOMC meeting, and May CPI figures hit during the June two-day Fed gathering. A lot can still happen.
Amid an ever-changing futures market, rate cuts are priced in starting in September. Before the hot jobs report last Friday, the thinking was that the Fed might slash rates starting as early as July. Regardless of when the true pivot happens, investors must grapple with the reality that short-term interest rates may be considerably lower a year from now; 5% money market yields will probably be short-lived.
The Debt Ceiling Showdown Draws Closer, Buffett Not Worried
Near-term, macro risks remain seen in the Treasury yield curve. The looming debt ceiling deadline has caused a very unusual kink in short-dated Treasuries that we talked about last week.
Interestingly, Warren Buffett assuaged some fears by confirming that Berkshire Hathaway owns some bills with bond equivalent yields near 5.9%. The Oracle of Omaha is not all that worried that the government will not fulfill its obligations.
As you would expect, Buffett was generally optimistic at the Berkshire annual shareholders’ meeting over the weekend. It was not a 100% rosy outlook, however. The world’s 5th richest man voiced concern about the state of the commercial real estate market amid steeper borrowing rates and the regional banking situation. He sees more Financials-sector turbulence ahead.
Nevertheless, rate traders are not as sanguine. The US 1-year sovereign credit default swap (CDS) trades at levels not seen in decades. At 120 basis points, it’s well above the peaks seen in previous debt ceiling showdowns. Ironically, the VIX ended last week back under 18. The age-old battle between the bond market and stock market as to who is right is playing out.
Treasury CDS Flashes a Warning Sign, A Sub-20 VIX Says ‘No Worries’
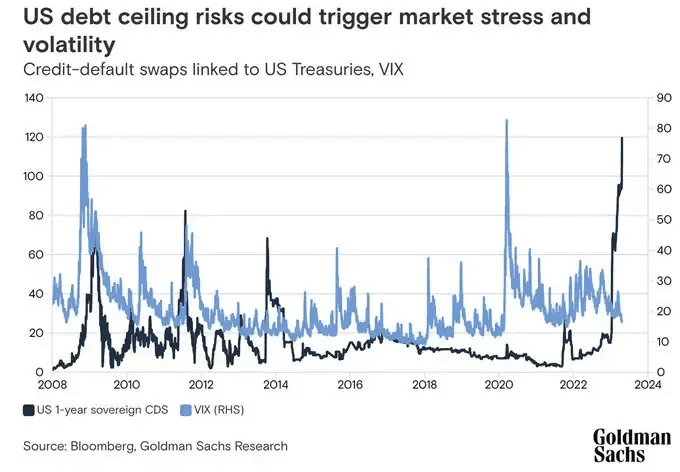
Source: Goldman Sachs
Gold Powers Higher, Struggles Near All-Time Highs
Turning back to the markets, let’s home in on the gold trade. The precious metal once again flirted with new all-time highs. It peaked last week just shy of $2100 on an intraday basis but faltered amid a risk-on environment Friday. Still, spot gold has performed well in the last two months.
Over many short and intermediate timeframes, the popular (sometimes infamous) GLD ETF has outperformed stocks and bonds (domestic and global). In the last six months, GLD has rallied more than 23%, better than the ex-USA stock market. During that span, SPY, including dividends, has returned just 12%.
ETF Performances Last 6 Months: GLD Beats Stocks and Bonds
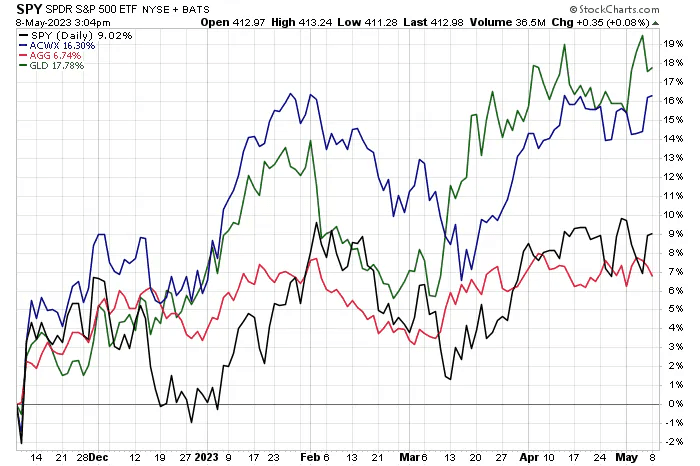
Source: Stockcharts.com
Gold bugs might be getting a bit antsy, though. The $2060 to $2080 range has been met with selling pressure every time. It seems, as of now, gold’s fate is tied to moves in the greenback. The US Dollar Index (DXY) has been consolidating right near its lowest mark in over a year. The 100 to 101 zone is seen as support, and the low last Thursday nearly broached that important area. Should the buck break down through 100 and hold under triple digits, then the gold bulls may finally break through the gates.
US Dollar Index Holding Key Support Near 100

Source: Stockcharts.com
What could get gold running? More bank failures, Fed-induced liquidity injections, and an explicit backstop of customer deposits at financial institutions could be macro drivers. We will be monitoring that dynamic over the coming weeks.
The Bottom Line
The US economy keeps humming along at first blush. The April employment report featured a 13th straight headline jobs number beat while the unemployment rate flushed to fresh lows since 1969. The robust payrolls figure no doubt keeps another 25-basis-point rate hike on the table at the June 14 FOMC meeting, but the likelihood is that the Fed is done raising rates. Amid yet another better-than-expected earnings season, the looming recession is delayed once again.
We will keep watching how the banking turmoil unfolds. The goal is to find out whether, as Jamie Dimon put it last week when he was quoted saying "the worst is behind us,” or whether price action may be telling us something entirely different.
Want access to your own expert-managed investment portfolio? Download Allio in the app store today!
Related Articles


The articles and customer support materials available on this property by Allio are educational only and not investment or tax advice.
If not otherwise specified above, this page contains original content by Allio Advisors LLC. This content is for general informational purposes only.
The information provided should be used at your own risk.
The original content provided here by Allio should not be construed as personal financial planning, tax, or financial advice. Whether an article, FAQ, customer support collateral, or interactive calculator, all original content by Allio is only for general informational purposes.
While we do our utmost to present fair, accurate reporting and analysis, Allio offers no warranties about the accuracy or completeness of the information contained in the published articles. Please pay attention to the original publication date and last updated date of each article. Allio offers no guarantee that it will update its articles after the date they were posted with subsequent developments of any kind, including, but not limited to, any subsequent changes in the relevant laws and regulations.
Any links provided to other websites are offered as a matter of convenience and are not intended to imply that Allio or its writers endorse, sponsor, promote, and/or are affiliated with the owners of or participants in those sites, or endorses any information contained on those sites, unless expressly stated otherwise.
Allio may publish content that has been created by affiliated or unaffiliated contributors, who may include employees, other financial advisors, third-party authors who are paid a fee by Allio, or other parties. Unless otherwise noted, the content of such posts does not necessarily represent the actual views or opinions of Allio or any of its officers, directors, or employees. The opinions expressed by guest writers and/or article sources/interviewees are strictly their own and do not necessarily represent those of Allio.
For content involving investments or securities, you should know that investing in securities involves risks, and there is always the potential of losing money when you invest in securities. Before investing, consider your investment objectives and Allio's charges and expenses. Past performance does not guarantee future results, and the likelihood of investment outcomes are hypothetical in nature. This page is not an offer, solicitation of an offer, or advice to buy or sell securities in jurisdictions where Allio Advisors is not registered.
For content related to taxes, you should know that you should not rely on the information as tax advice. Articles or FAQs do not constitute a tax opinion and are not intended or written to be used, nor can they be used, by any taxpayer for the purpose of avoiding penalties that may be imposed on the taxpayer.