Updated July 4, 2023

Raymond Micaletti, Ph.D.
Macro Money Monitor
Market Recap
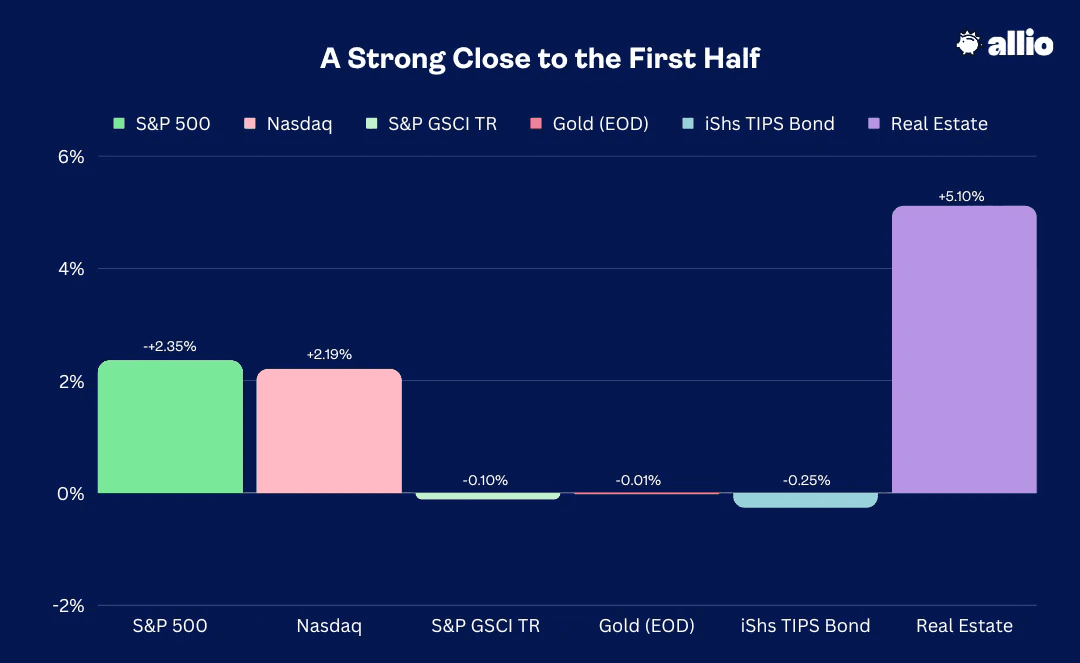
Stocks finished the first half with a flourish. The S&P 500 rose 2.4% last week while the NASDAQ Composite notched a 2.2% advance. Small caps outperformed while the Real Estate sector posted its second-best weekly gain in 2023, rising more than 5%. Elsewhere, commodities, gold, and the TIPS market were all quiet, each group settling fractionally down in the final week of June. The aggregate bond market fell 0.3% amid a continued rise in interest rates while the dollar crept higher.
This week, market-moving macro events include FOMC minutes Wednesday afternoon and key labor market indicators throughout the holiday-interrupted trading week.
June 23, 2023 - June 30, 2023
Looking Back on a Strong First Half
“The stock market is never obvious. It is designed to fool most of the people, most of the time” - Jesse Livermore
Let’s step back in time to the end of 2022. The feeling on Wall Street and Main Street was much different compared to the excitement and hope of today. Last December featured dismal investor sentiment and a cast of Wall Street strategists who were more bearish than they had been in decades.
Consider that the average forecast for where the S&P 500 would finish 2023 was actually down compared to where the index stood late last year. For the first time in more than 25 years, the experts were calling for another year of negative returns following the steep losses index investors endured in 2022. You must remember that so-called “sellside” market forecasters usually have a bullish bias, normally predicting a ho-hum and non-controversial 8% to 10% yearly rally in the S&P 500, so the expectation for a down year made headlines last December.
The Wall Street Consensus Has Gotten It Badly Wrong in 2023
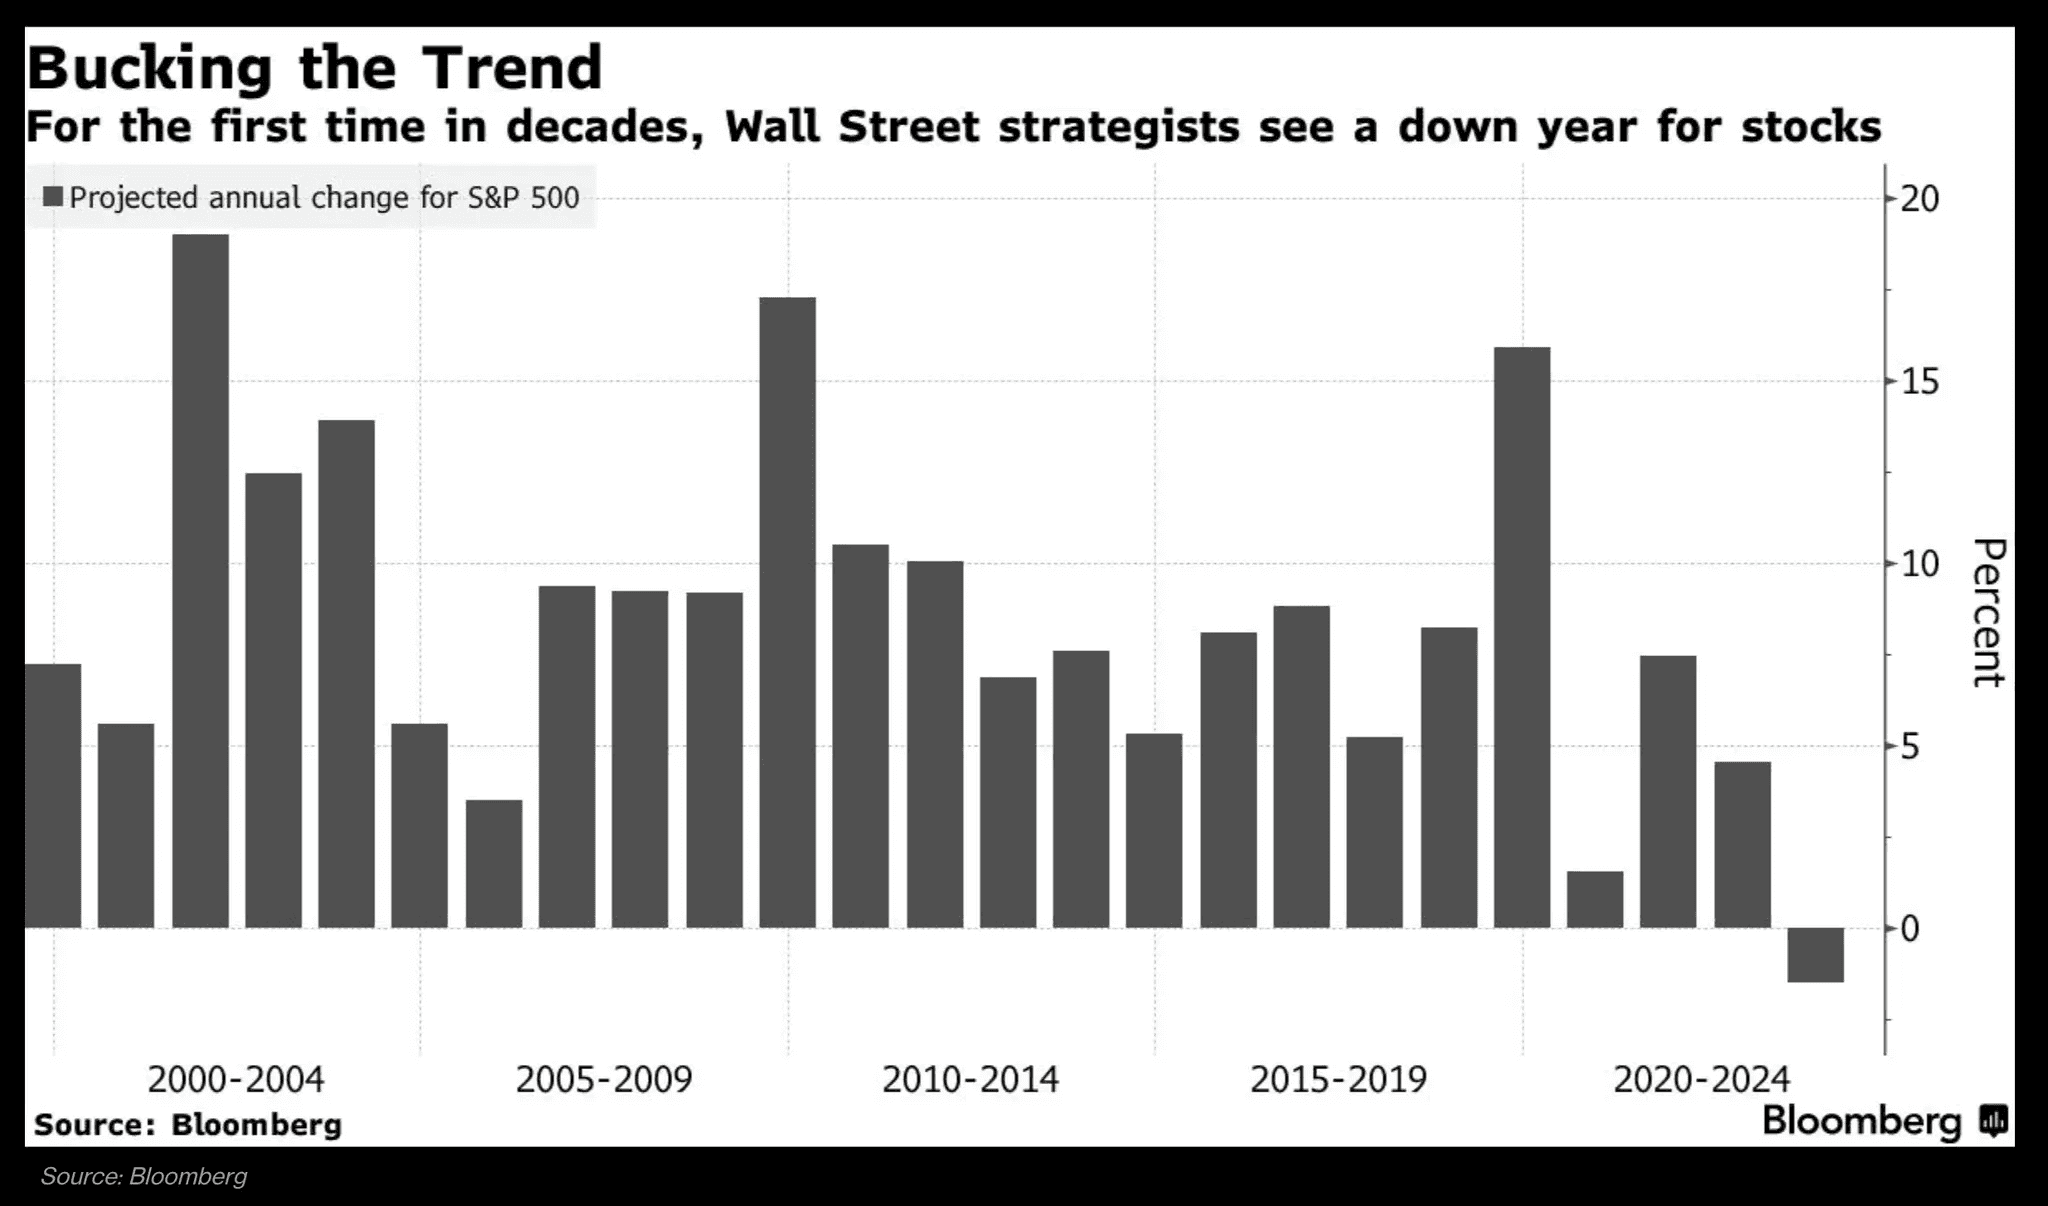
Source: Bloomberg (as of December 2022)
NASDAQ Surges to its Best First-Half Performance in Four Decades
That strange aura of bearishness cast by Wall Street’s so-called experts proved to be a dreadful collective call. Jump ahead to today, and investors who dismissed these dour outlooks can celebrate with a few extra fireworks this week. All told, the SPX rose nearly 17% with dividends included while small caps posted a more modest, though still respectable, 8% total return in the first six months of 2023.
Of course, the shooting star in the summer night sky continues to be tech. The Information Technology sector’s return was truly lit at a more than 40% gain as the Nasdaq 100 ETF (QQQ) had its best first-half rally on record. (The broader NASDAQ Composite exploded like an M-80 firecracker for its biggest 1H gain since 1983.)
Happy Independence Day! Relating Fireworks to Your Finances.
Sure, equity investors can take a moment to appreciate that their holdings may be sparkling brighter than a Fourth of July show, but at the same time, it’s key to always remember that just staying invested is perhaps the most important thing you can do. It is simple, but sometimes not easy. Much like lighting a firework’s fuse, setting up a regular investing plan, say $500 per month (or even just $50), is step one, and from there, the money flame starts a chain reaction of potential growth and excitement.
Over years, not days or weeks, you will begin to see your portfolio slowly climb, not quite as exciting as the immediate bright burst of a firecracker on Independence Day, however. Also akin to 4th of July fun, is careful consideration to risk management: You must be safe and make responsible decisions when setting explosives ablaze. Likewise, you need a solid investment game plan to ensure that you reach financial independence with a dazzling display of assets.
Danger Zone: Cash?
Let’s get back to the markets. This year was particularly perilous in that for the first time in many millennial and Gen Z investors’ lifetimes, there was an appealing cash alternative. Late in 2022, you could have stood on the market’s sidelines and earned more than 4% by simply sitting in cash. That felt like a reasonable choice given spiking volatility across the stock and bond markets in early Q4 last year. This reality underscores a key risk we hinted at earlier – cash can feel like a protective shield, safeguarding you from wild markets, but the big risk is missing out on bull markets elsewhere. That’s precisely what took place over Q1 and Q2 of 2023.
Federal Funds Effective Rate (2001-2023): Hiding in Cash Has Proved Relatively Costly This Year
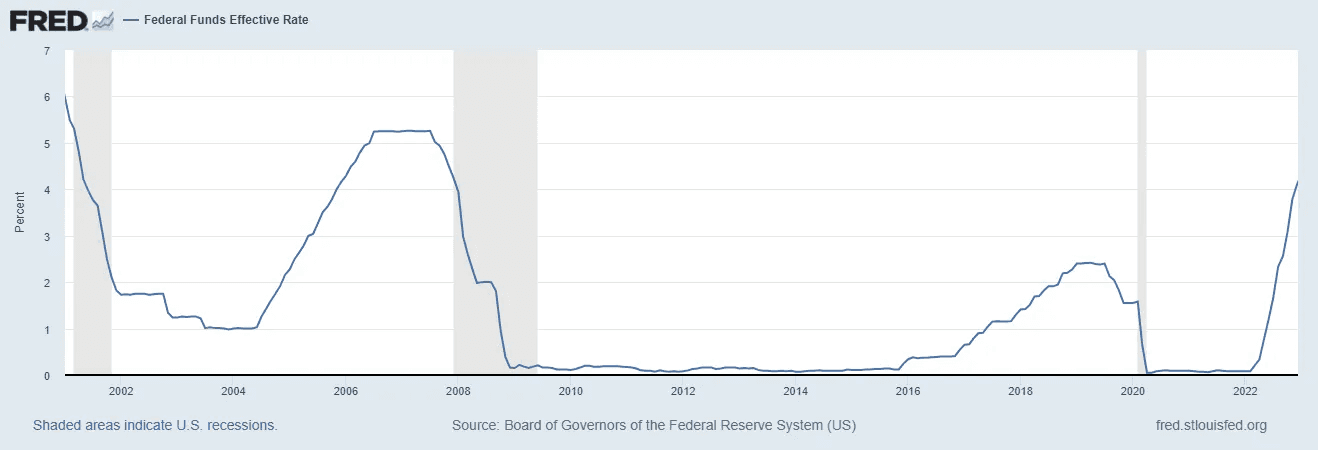
Source: St. Louis Federal Reserve
So, we continue to urge our members and readers to not put much credence in what these Wall Street pundits have to say. It’s better to pay attention to what the market is telling us and to perform independent risk management with evidence-based macro-investing strategies.
That is what we do at Allio. We were boldly overweight tech stocks for much of the first half while many gurus called for an imminent pullback. More importantly perhaps, we always want our members to keep to their investment approach amid both bearish despondency and bullish fervor. In both market scenarios, our team of expert hedge fund veterans constructs evidence-based, tactical risk management strategies.
Looking Ahead: Opportunities and Risks
Heading into the second half, the landscape has shifted. We now see bullish investor sentiment, the expectation for a soft landing or even no landing at all (meaning no recession), and the S&P 500 priced nearly 20 times its forward earnings per share estimate. There are certainly fewer stocks in the bargain bin, but not all sectors and styles are overly expensive.
Look at it this way: The “Magnificent Seven” stocks (Apple, Microsoft, Alphabet, Amazon, NVIDIA, Tesla, and Meta) were responsible for about 75% of the S&P 500’s year-to-date total return through June. Those seven names rose about 90% collectively (equally weighted) during the January through June stretch. Moreover, the growth-heavy Information Technology, Communication Services, and Consumer Discretionary sectors teamed up to produce a stunning 97% of the SPX’s first-half gain.
Greed Over Fear in the Second Half?
The good news for the bulls is that a strong Q1-Q2 stretch usually begets a continuation of the rally in the ensuing second half, particularly after a down year. BofA points out that the S&P 500 is up 86% of the time from July through December after notching a positive first half (preceded by a negative full year). That all aligns with bullish animal spirits currently raging and a lack of any meaningful pullbacks since the Silicon Valley Bank and U.S. regional banking turmoil in March. Our Alpha Blog will continue to dive into where to identify key opportunities, so stay tuned.
Strong First-Half Returns After a Down Year Often Breed More Gains in the Second Half

Source: BofA Global Research
Important Inflation Data Last Week
Amid these emerging goldilocks vibes, there was generally good news on the inflation front to cap off June. Friday morning’s economic readings were noteworthy: Personal Consumption Expenditure (PCE) figures for May revealed that the trend of lower consumer price climbs continues. The Core PCE on a year-on-year basis is now down to 4.6%. That is still well above the Federal Reserve’s target of about 2%, but it is going in the right direction. With higher-than-expected June personal income and slightly softer spending data, Americans increased their collective personal saving rate (PSR) to 4.6% (though that remains well below the pre-pandemic average of just under 10%.
Key Data Last Friday: Encouraging Inflation Trends, Fed Expected to Hike on July 26
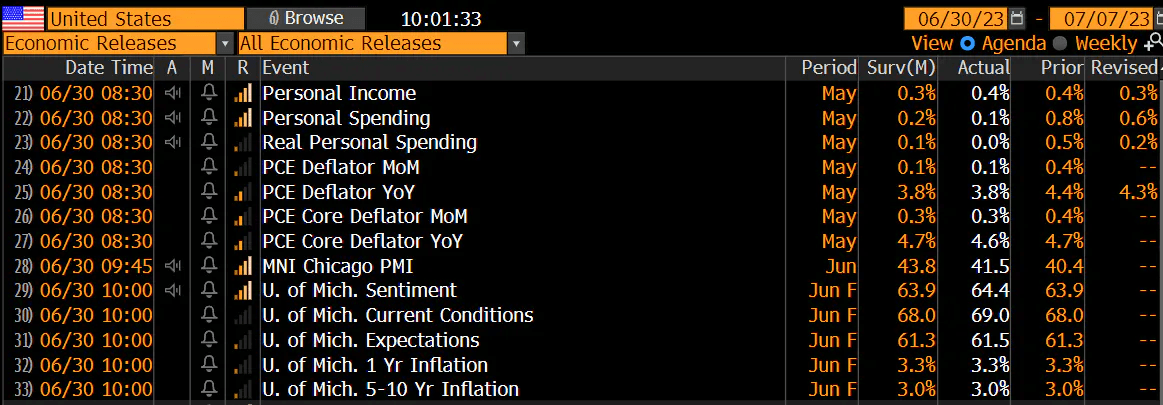
Source: Bloomberg
Focusing on the Consumer and Inflation
The last piece of macro data crossing the wires last Friday was June’s final read on consumer sentiment. While the survey showed an uptick from the initial look, inflation expectations (closely monitored by the Fed) came in on par with what economists were expecting.
American families and bond traders are coming closer together in their inflation predictions. While households see 1-year forward inflation being near 3.3% with a 5-10 year annualized price rise rate of 3%, the inflation swaps market prices 1-year CPI to be near 2.5% with a longer-term range of 2.4% to 2.6%.
Lastly, macro analysts like to gauge the TIPS market for implied breakeven rates (it sounds complicated but it’s really just comparing the yields on Treasuries to yields on TIPS), and that market says inflation will be 2.2% over the next 5 years and 2.3% in the 5-10 year period.
TIPS Breakevens: Generally Tame Inflation Rates Priced In
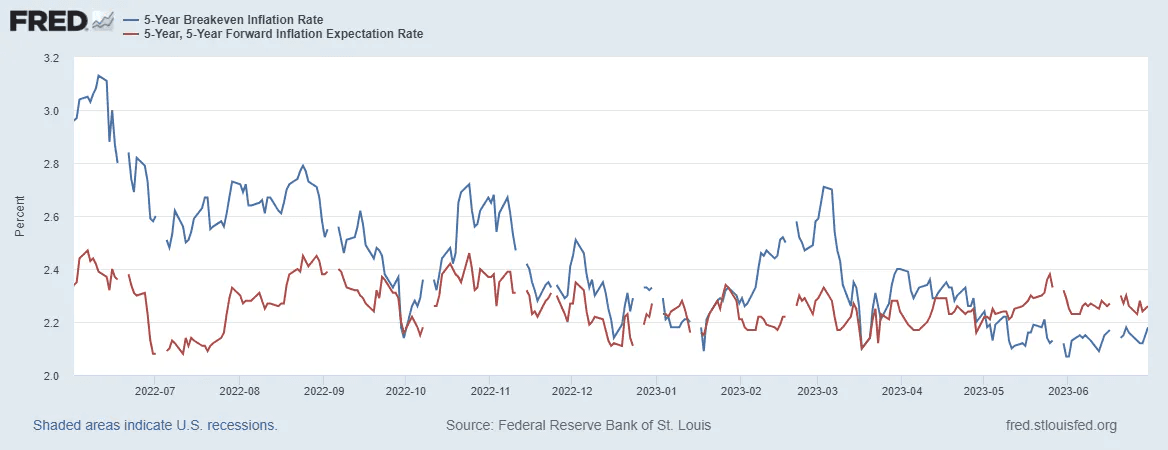
Source: St. Louis Federal Reserve
Fed Decision Looms
Is that enough data for you? This is exactly what the Fed does each day. The Federal Open Market Committee (FOMC) is always tracking inflation expectations, and another Fed decision is on the way this month. July 26 is when the next interest rate increase is expected. Chair Powell suggests it will be the first of two final hikes, though bond traders beg to differ: The CME FedWatch Tool shows a high 87% probability of a quarter-point increase to the 5.25% to 5.50% target range. While a 1-in-3 chance of yet another hike is priced in by the November 1 FOMC gathering, this month could be the end of the Fed’s tightening campaign.
What’s different today, however, is that forecasters seem to believe the Fed’s dot plot more than ever. Recall earlier this year when traders eschewed the FOMC’s forecast of continued rate increases with no cuts this year. Today, that’s just about the consensus view. So, in an unusual twist (relative to what often happens), the market has moved closer to the Fed (not vice versa). Assuming they do hike in three weeks, the first policy rate decrease is not expected until March next year. Overall, the peak policy rate has crept back up to near 5.5% after dipping to 4.75% post-SVB, but a ‘higher for longer’ reality has set in.
The Terminal Rate Marched Higher in Q2, No Cuts Expected in 2023
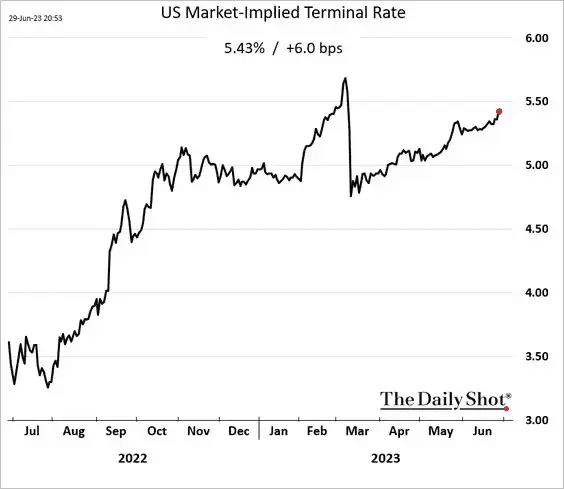
Source: The Daily Shot
Credit Crunch Risks Rising
Sooner or later, tighter credit conditions will appear in equities. Our Alpha Blog has highlighted the rise in corporate bankruptcies this year, but here’s another way to measure what could be a credit crunch brewing. The notional share of “hard defaults” is now at the highest level in a decade, according to Goldman Sachs research and Moody’s data. Let’s spell that out: “Notional” simply means the value of a corporate bond, while a technical default happens when a bond misses an interest payment or if the issuing firm files for Chapter 11 or Chapter 7 bankruptcy protection.
While nowhere near 2001 or 2008 extreme levels, 2023’s hard default reading (compared to less serious “soft defaults”) may be the canary in the coal mine. After all, flip on financial TV and all you will hear is how revolutionary AI will be, that inflation and growth trends may portend an economic expansion (not recession), and that the corporate earnings picture is turning more sanguine. Few are considering emerging credit risks. As macro conditions keep tightening, more pressure is being put on the balance sheets of firms worldwide at the micro level.
A Significant Increase in Hard Defaults Relative to Soft Defaults YTD

Source: Goldman Sachs
The Bottom Line
It was a first-half heater for US tech stocks. Hot June returns featured a broadening out of the rally with small caps outpacing large caps and the risk-on sectors of Consumer Discretionary, Industrials, and Materials all posting double-digit-percent gains. For investors who disregarded bearish Wall Street expert opinions from late last year, enjoying a hot dog and a cool drink is deserved as America celebrates Independence Day. With the second half underway, emerging macro risks must be recognized, but bullish animal spirits are likely to drive more positive momentum in the near term.
Want access to your own expert-managed investment portfolio? Download Allio in the app store today!
Related Articles


The articles and customer support materials available on this property by Allio are educational only and not investment or tax advice.
If not otherwise specified above, this page contains original content by Allio Advisors LLC. This content is for general informational purposes only.
The information provided should be used at your own risk.
The original content provided here by Allio should not be construed as personal financial planning, tax, or financial advice. Whether an article, FAQ, customer support collateral, or interactive calculator, all original content by Allio is only for general informational purposes.
While we do our utmost to present fair, accurate reporting and analysis, Allio offers no warranties about the accuracy or completeness of the information contained in the published articles. Please pay attention to the original publication date and last updated date of each article. Allio offers no guarantee that it will update its articles after the date they were posted with subsequent developments of any kind, including, but not limited to, any subsequent changes in the relevant laws and regulations.
Any links provided to other websites are offered as a matter of convenience and are not intended to imply that Allio or its writers endorse, sponsor, promote, and/or are affiliated with the owners of or participants in those sites, or endorses any information contained on those sites, unless expressly stated otherwise.
Allio may publish content that has been created by affiliated or unaffiliated contributors, who may include employees, other financial advisors, third-party authors who are paid a fee by Allio, or other parties. Unless otherwise noted, the content of such posts does not necessarily represent the actual views or opinions of Allio or any of its officers, directors, or employees. The opinions expressed by guest writers and/or article sources/interviewees are strictly their own and do not necessarily represent those of Allio.
For content involving investments or securities, you should know that investing in securities involves risks, and there is always the potential of losing money when you invest in securities. Before investing, consider your investment objectives and Allio's charges and expenses. Past performance does not guarantee future results, and the likelihood of investment outcomes are hypothetical in nature. This page is not an offer, solicitation of an offer, or advice to buy or sell securities in jurisdictions where Allio Advisors is not registered.
For content related to taxes, you should know that you should not rely on the information as tax advice. Articles or FAQs do not constitute a tax opinion and are not intended or written to be used, nor can they be used, by any taxpayer for the purpose of avoiding penalties that may be imposed on the taxpayer.