Updated July 25, 2023

Raymond Micaletti, Ph.D.
Macro Money Monitor
Market Recap
Stocks bounced around the flat line last week, though the S&P 500 did manage to settle at its highest weekly close since March of 2022. Defensives and cyclical sectors led the charge with Energy and Health Care both sporting the best gains, up 3.5% each. The NASDAQ Composite finished lower ahead of key tech earnings this week and next.
Commodities continue to sport relative strength, something we picked up on earlier this month; the S&P SGCI commodity index jumped more than 2% last week. Gold, however, rose just fractionally as the dollar fought its way back. The bond market was flat, though inflation-protected fixed-income rose a notable 0.5%. Finally, after a strong three-week advance, the Real Estate sector paused its uptrend, dropping half a percent.

7/14/23 - 7/21/23
The Look Ahead
A chock full of volatility catalysts are front and center. Call it a blockbuster few days following box office excitement over the weekend. We are now in the busiest two weeks of the Q2 reporting period and the Fed is widely expected to announce another quarter-point rate hike Wednesday, perhaps the last of its tightening campaign.
Summer Melt-Up
Last week, the financial media was focused on the Dow’s daily winning streak. The blue-chip index, which has more exposure to Health Care and significantly less weight to the Information Technology sector, indeed has been on a heater. The price-weighted and century-old average has been buoyed by a sudden rebound in its biggest weight, UnitedHealth Group (UNH). The DJIA had been underperforming throughout 2023 amid a persistent mega-cap tech-led rally.
It’s Hot Out There. Everybody in the Pool!
Things have shifted under the market’s surface since the beginning of June, though. For a host of macro reasons, small caps along with cyclical niches of the US equity market are emerging leadership areas. Their alpha is not massive, but we are seeing upside participation across the market cap and style spectrums. Most technicians would deem this as a healthy trend, but it comes alongside much frothier market sentiment conditions and persistent flows into the I.T. sector.
Investors Keep on Pouring Cash into Tech

Source: BofA Global Research
Are the Waters Turning Too Warm?
The American Association of Individual Investors (AAII) published its weekly sentiment survey, and the percentage of bulls minus bears (net bulls) has reached the highest level since early 2021. That’s when stimulus checks were being tossed out to most people and IPO and SPAC mania was in full swing during a period of record-low borrowing costs. Now, it’s key to recognize that bullish fervor can endure on Wall Street and Main Street for extended periods, but clearly, we are in a much different psychological state versus late last year.
A Summer of Stock Market Love Among Retail Traders
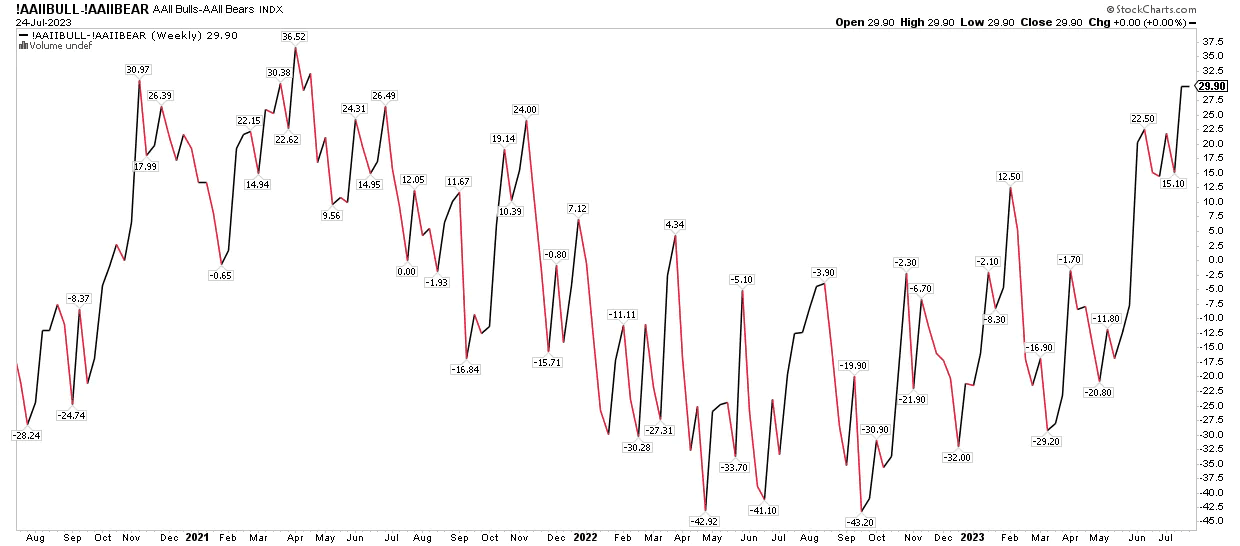
Source: Stockcharts.com
What could disrupt the sanguine tone among investors? That is what strategists must always be on the hunt for when spotting possible upside and downside catalysts. Commodities continue to be an overlooked part of the macro landscape. Last Friday, the S&P Goldman Sachs Commodity Index (GSCI) settled at its best mark since April. The index is heavy on energy products, so movements in US and foreign crude oil, along with trends in gasoline and natural gas, are key. After a 20% advance off the Q2 low, oil prices have been on the rise, impacting both consumers and multinational corporations.
For the last year-plus, we have all enjoyed a general decline in the cost of a fill-up, and companies no doubt breathed a sigh of relief when the surge in energy, agriculture, and industrial materials prices ended abruptly in June of 2022. Could that bullish backdrop be reversing? If this summer commodity rally has legs, then expenses could creep up for firms big and small while consumers could face higher commuting costs.
A Dollar Bounce, But More Evidence Needed to Confirm a Bullish Reversal
Maybe more remarkable about recent price action is that the latest commodity thrust coincides with a bounce higher in the US Dollar Index. Earlier in July, the “DXY” dropped under the psychologically important 100 level as well as the technically crucial 100.40 to 101.40 range. Last week, however, the greenback gained in four straight sessions.
In general, there is often an inverse relationship between the dollar’s movements and how commodities perform. Moreover, a lower USD is often favorable for risk-on assets like stocks. Finally, a weaker home currency makes it easier for American companies to beef up their bottom lines as they sell abroad and repatriate profits. Expect more attention to be paid to macro movements in commodities and the dollar in the months ahead, particularly as election season heats up.
US Dollar Index Stumbles Below 100, Then Rallies to Key Resistance
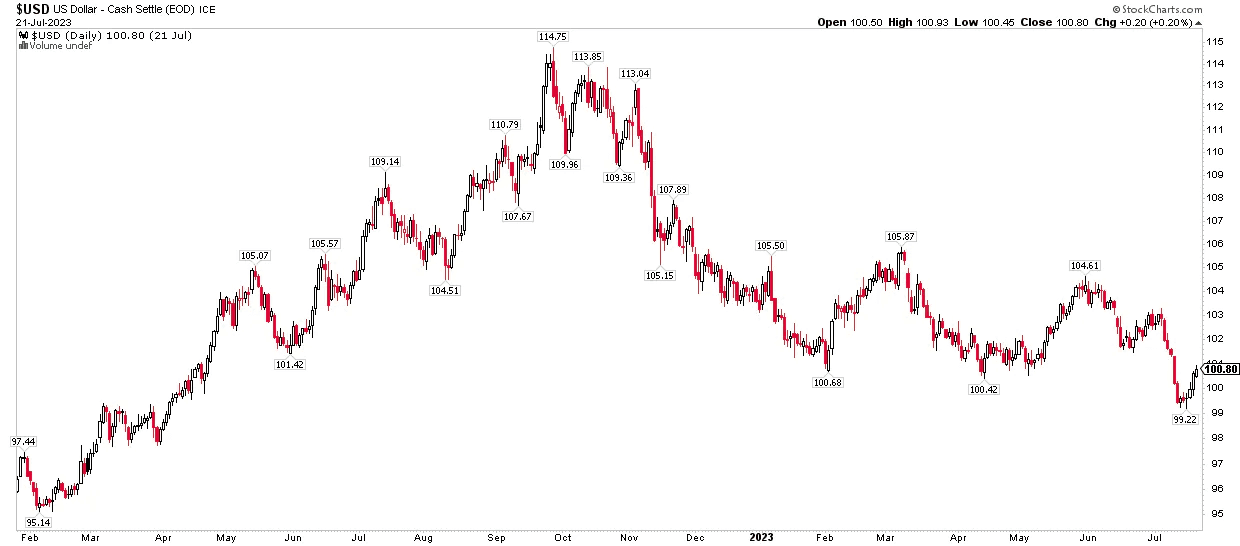
Source: Stockcharts.com
With this ebbing and flowing intermarket backdrop, the economic picture may become a bit less murky by the time we get through early August. We’ve talked about how uncertainty has been running unusually high lately, but this week we will get what might be the final Federal Reserve interest rate increase along with a first look at how the US economy performed in the second quarter.
Real Estate’s Rebound
Part of the impressive nature of both the S&P 500’s performance and economic growth thus far in 2023 has been how well the housing market has held up in the face of much higher interest rates. First-time home buyers surely eye current mortgage rates with frustration and discouragement. Mortgage News Daily shows stubbornly high 30-year fixed-rate mortgage percentages around 7%, but home values appear to be stabilizing—even rising in some regions.
We will get a May update on the Case-Shiller Home Price Index Tuesday morning before the bell. We don’t put a ton of weight on that report since it’s not a very fresh glimpse. It is more useful to refer to real-time gauges offered by the private sector. Redfin’s latest update shows US real estate values higher from year-ago levels for the first time since early this year. While that’s good news for homeowners, it could keep inflation uncomfortably high for the Fed.
Home Prices Climb 2% From YoY, With Very Low Supply Spurring Competition

Source: Redfin
So, let’s home in on central bank policy. It’s an eventful week, underscored by Wednesday afternoon’s FOMC decision and Powell press conference, but it is not the only key event. The European Central Bank (ECB) issues its next update on Thursday morning. The Euro Area continues to struggle with much higher inflation and significantly weaker economic data relative to expectations.
Euro Area Inflation Much Hotter Than US CPI

Source: Apollo Global
Central Bank Drama
A handful of monetary authorities hold meetings over the coming days while there has not been much change in the market’s expectation for Fed policy. Traders have priced in a near certainty of a 0.25% hike while there’s about a 30% chance of a second increase later this year. Short-term yields are then expected to gradually decline starting in early 2024, but that is largely dependent on a downturn in GDP growth. It’s quite possible that Powell, and his colleagues at the monetary policy helm, will be forced to hold the Fed Funds target rate high to bring inflation down to the 2% target level.
Bringing inflation down from 9% to 3% is actually the easy part. But, like losing those last 5 or 10 pounds, taking CPI and PCE from 3% to 2% is more arduous for central bankers.
Keeping inflation on the high side will likely be this never-say-die employment situation. Last week, the Initial Jobless Claims report revealed the lowest total since February if you back out Ohio and Minnesota tallies (those states have had data collection issues over the past two months). While we won’t get the next update on the broader jobs market until August 4, rising wages and an unemployment rate that hovers near five-decade lows are unquestionably inflationary pressures should they persist through year-end.
With so many workers benefitting from a robust labor market and improving salaries, spending has been decent (though not stellar), leading to continued economic expansion. Along with a fresh read on jobless claims this Thursday morning, traders will get a first look at the Q2 advance report on GDP. Expectations suggest that the economy grew at a 1.8% seasonally adjusted annual rate, but we are more interested in some of the report’s other details.
The GDP Price Index along with quarterly personal consumption figures (including Core PCE) will move markets. That inflation data comes after a string of assuring consumer price indicators lately. Will the positive trend persist? That’s the big question.
Friday is another busy day of economic barometers. June’s PCE figures are due out in the premarket which are likely to be impactful. Less important will be the final gauge of consumer sentiment—we profiled the positive turn in household feelings last week.
A Long Slate of Economic Updates

Source: Bank of America Global Research
Finally, Q2 earnings season goes into overdrive Tuesday morning. While Whirlpool is seen as a proxy for households’ durable goods spending trends, major companies across sectors report later in the days thereafter.
Mega-cap tech will be the focus of afternoon TV coverage. Microsoft and Alphabet report second-quarter earnings Tuesday after the bell while Meta issues its report Wednesday afternoon. Mastercard, McDonald’s, and Ford are the standouts on Thursday. Then eyes turn to the Energy sector Friday morning when ExxonMobil and Chevron, half of the oil & gas market cap space, report Friday.
The Heart of Earnings Season This Week and Next
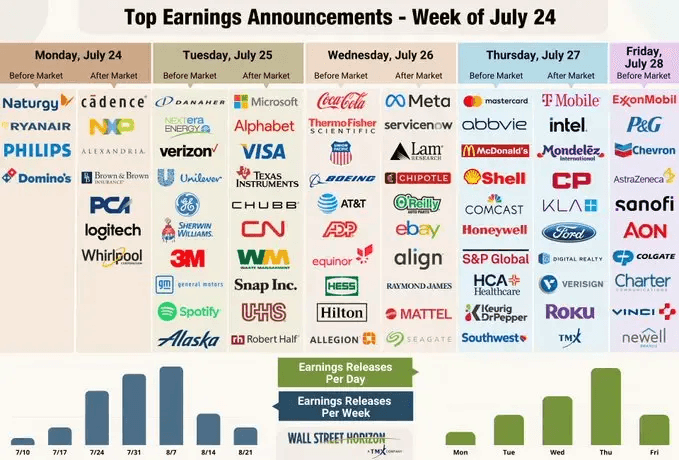
Source: Wall Street Horizon
So far, so good: FactSet notes that the Q2 EPS beat rate is right near the 5-year average at 75% with 18% of S&P 500 companies now in the books. Just 61% of early reporters have topped analysts’ revenue expectations, however. In all, a decline of 9% in year-on-year earnings is forecasted, the biggest drop since Q2 2020.
A troubling trend CEOs and CFOs are feeling hard is the fall off in the average S&P 500 company profit margin. The percentage peaked in Q2 2021 at 13%, a record high, but is now seen at 11.1% for this past quarter. Higher wages and the potential for increased raw material costs could ding margins further. This is something to monitor over the quarters ahead.
Another trend that bears watching, which could throw a wrench in the rally, is growing unrest among some labor groups. UPS and the Teamsters Union will hold talks on Tuesday to avert a strike. This saga is seen as a potential harbinger of collective bargaining trends.
The Bottom Line
Summer fun continues for the bulls. This year’s rally has broadened out to include small caps and value stocks following a stretch of very concentrated returns among the largest US equities. The consumer remains resilient, and investors are more upbeat about the state of the economy and markets. Still, risks lurk.
The dollar’s drop is usually a good thing for corporate profits, but rising commodity prices might result in larger expenses on income statements later this year. What’s more, interest rates ranging near cycle highs could crimp profit margins further as debt comes due. We’ll get fresh commentary on all these macro issues at the micro level as the earnings period wears on. Get your popcorn ready.
Want access to your own expert-managed investment portfolio? Download Allio in the app store today!
Related Articles


The articles and customer support materials available on this property by Allio are educational only and not investment or tax advice.
If not otherwise specified above, this page contains original content by Allio Advisors LLC. This content is for general informational purposes only.
The information provided should be used at your own risk.
The original content provided here by Allio should not be construed as personal financial planning, tax, or financial advice. Whether an article, FAQ, customer support collateral, or interactive calculator, all original content by Allio is only for general informational purposes.
While we do our utmost to present fair, accurate reporting and analysis, Allio offers no warranties about the accuracy or completeness of the information contained in the published articles. Please pay attention to the original publication date and last updated date of each article. Allio offers no guarantee that it will update its articles after the date they were posted with subsequent developments of any kind, including, but not limited to, any subsequent changes in the relevant laws and regulations.
Any links provided to other websites are offered as a matter of convenience and are not intended to imply that Allio or its writers endorse, sponsor, promote, and/or are affiliated with the owners of or participants in those sites, or endorses any information contained on those sites, unless expressly stated otherwise.
Allio may publish content that has been created by affiliated or unaffiliated contributors, who may include employees, other financial advisors, third-party authors who are paid a fee by Allio, or other parties. Unless otherwise noted, the content of such posts does not necessarily represent the actual views or opinions of Allio or any of its officers, directors, or employees. The opinions expressed by guest writers and/or article sources/interviewees are strictly their own and do not necessarily represent those of Allio.
For content involving investments or securities, you should know that investing in securities involves risks, and there is always the potential of losing money when you invest in securities. Before investing, consider your investment objectives and Allio's charges and expenses. Past performance does not guarantee future results, and the likelihood of investment outcomes are hypothetical in nature. This page is not an offer, solicitation of an offer, or advice to buy or sell securities in jurisdictions where Allio Advisors is not registered.
For content related to taxes, you should know that you should not rely on the information as tax advice. Articles or FAQs do not constitute a tax opinion and are not intended or written to be used, nor can they be used, by any taxpayer for the purpose of avoiding penalties that may be imposed on the taxpayer.