Updated August 8, 2023

Raymond Micaletti, Ph.D.
Macro Money Monitor
Market Recap
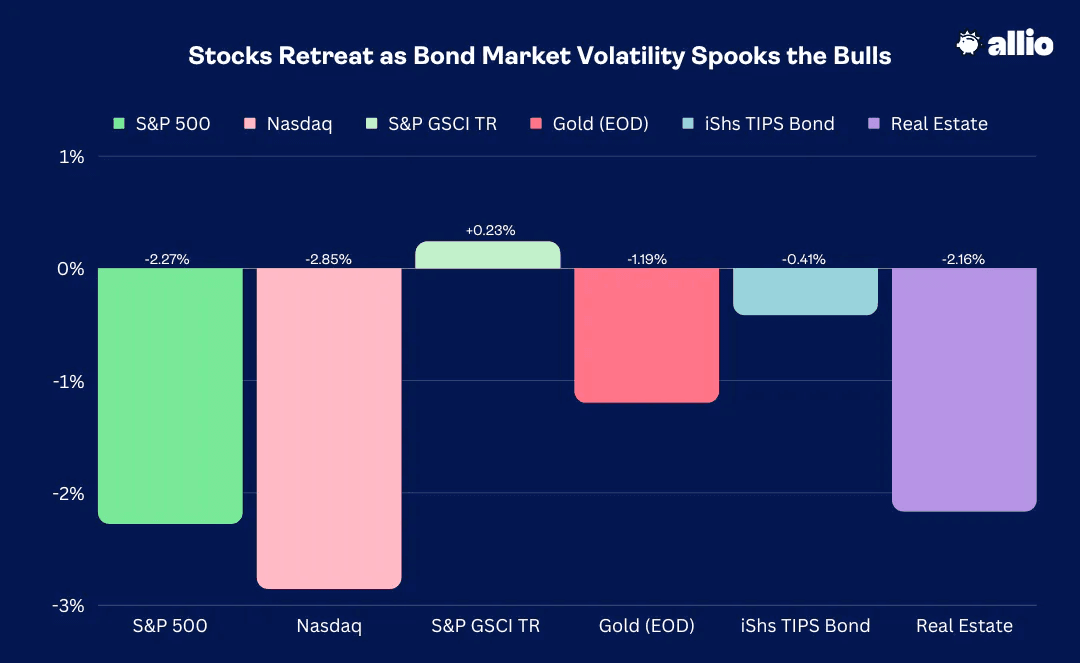
Stocks suffered their worst weekly drop since the Silicon Valley Bank turmoil in early March, but losses were not all that steep. It goes to show how strong markets have been since late Q1.
The S&P 500 lost 2.3% while the NASDAQ Composite declined nearly 3%. The Information Technology sector was the second-worst performing area following key earnings reports. Real Estate, meanwhile, was down about on par with the S&P 500 – rising interest rates have been plaguing that sector, though Friday’s bid for bonds did little to attract buyers.
Continued interesting action has taken place in commodities – the GSCI Index was up for the week, despite gold ending down, as Energy was the lone positive sector. As hinted at earlier, fixed-income investors endured a wild ride with sharply rising rates which then retreated after Friday’s ho-hum employment report. In the end, the aggregate bond index was down 0.6% with TIPS sporting a slightly less negative return.
July 28, 2023 - August 4, 2023
The Look Ahead
While the bulk of Q2 earnings reports are in the books, the focus now shifts to the consumer. Among the major firms issuing results this week are Tyson, Paramount, Eli Lilly, UPS, Honda, Disney, and Novo Nordisk. The major retailers then report mid-month.
On the economic front, the focus will be on Thursday’s July CPI report which is expected to reveal a 0.2% month-on-month price increase while the Headline rate on a year-over-year basis is seen rising to 3.2% from June’s 3.0% level. Producer Price Index hits on Friday along with a first look at the August University of Michigan Sentiment survey.
Following some Fed Speak Monday morning by Bostic and Bowman, Harker presents Tuesday before the bell and Bostic issues more remarks about employment Thursday afternoon.
Earnings Season: Health Care & Consumer Companies in Focus this Week

Source: Wall Street Horizon
Bond Market Rattled by Fitch’s Credit Rating Downgrade
What is it about August and drama stirred up by credit rating agencies? It was about this time in 2011 when Standard & Poor’s downgraded US debt from a pristine AAA rating to AA+. Back then, a significant debt debacle was happening in Europe and investors were still anxious considering that the 2007-09 Great Financial Crisis was barely in the rearview mirror.
Following S&P’s re-rating of the US’ credit standing, stocks plunged, dropping nearly 7% in a single session. Equities would not find their low until early October of that year while Treasury yields also cratered, driven by a perceived flight to safety in, of all things, the very same bonds that were deemed less safe, per S&P.
Fast forward to 2023, and Fitch decided to do the same. Tuesday evening last week, Fitch, arguably the third wheel of the major credit raters, joined S&P by deeming Treasury securities AA+, down from AAA status. In its view, Fitch claims that a deterioration in governance operations could impact budgetary matters in the quarters and years ahead. Recall it was just a few months ago when the US nearly defaulted on a small portion of short-term Treasury bills. Expect this to be a talking point on the campaign trail as the first GOP debate is slated for later this month.
The market’s reaction was quite a bit different this time around, though. Stocks wavered modestly but volatility was largely held in check. More interesting price action was seen in the fixed-income market.
Unlike in August of 2011 when big-time buying came into Treasuries of all maturities, we saw selling of US government notes and bonds during the middle of last week. The benchmark 10-year yield rose a few basis points, continuing its trend higher that began in earnest some three months ago.
10-Year Treasury Note Yield Last Week: Bump Up After the Fitch Downgrade
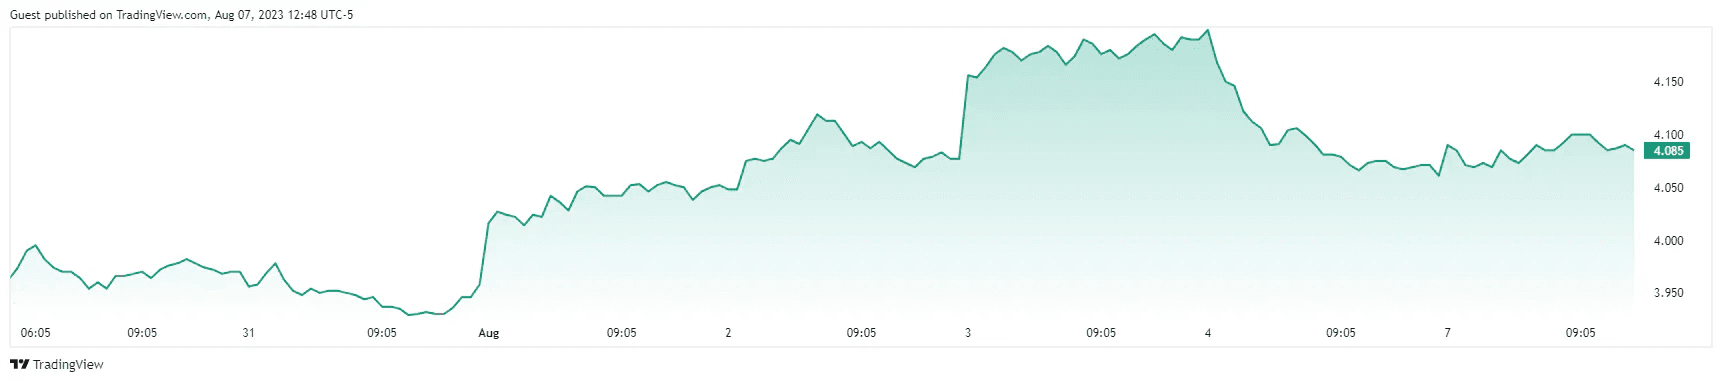
Source: TradingView
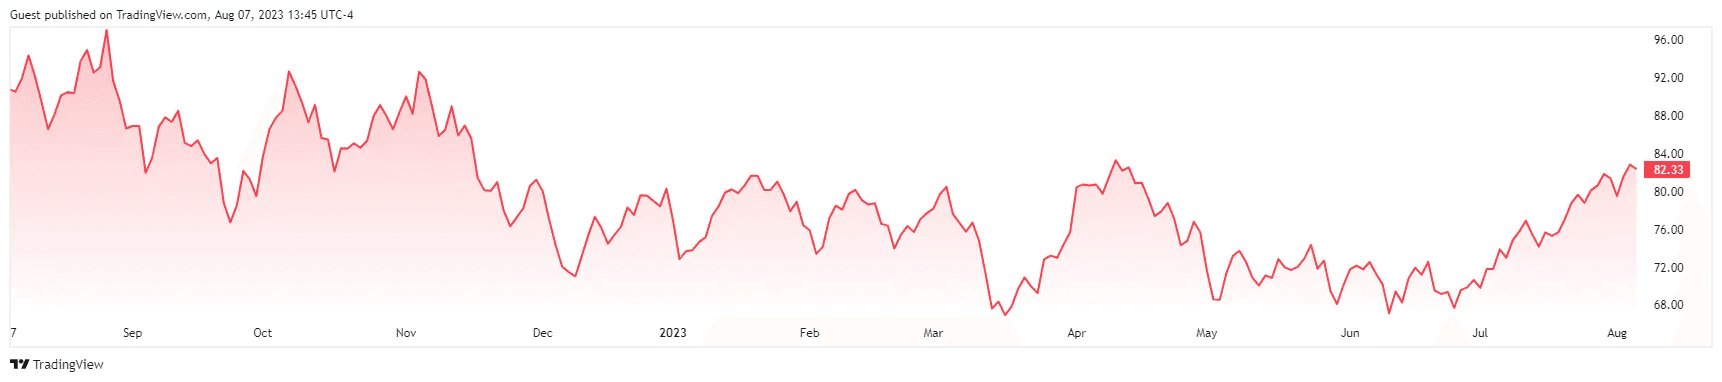
The real action was seen in the 30-year. The “long bond,” in trader parlance, has been rocketing higher in terms of its yield, meaning investors have been selling extended-duration Treasuries. It was just a few weeks ago that the 30-year rate was under 3.9%. That previous consolidation under the psychologically important 4% threshold ended toward the finish of July. A nearly 0.5 percentage point increase culminated in a thrust higher after the “Fitch slap” Tuesday night last week.
30-Year Treasury Yield Last Six Months: Fresh 2023 Highs as Investors Flee Bonds
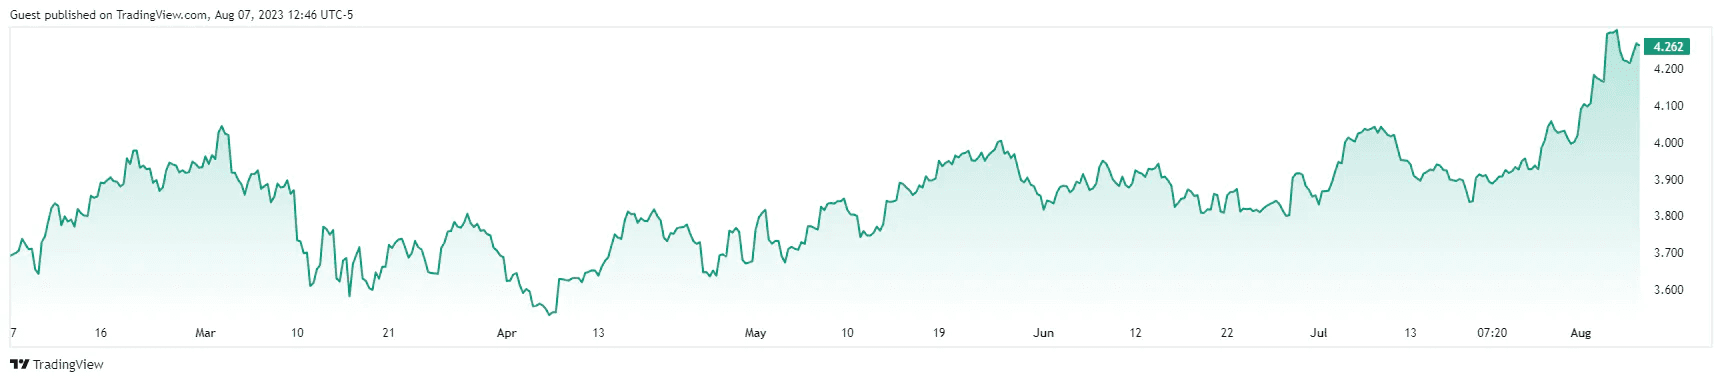
Source: TradingView
So, what gives? Why the 180 in terms of trader reaction this time? Well, fears are more real now that the government may have to issue more debt just to pay interest to existing bondholders. You see, the average rate across the Treasury curve is, call it, 4.6% today. Contrast that to Q3 of 2011 when the yield curve was suppressed much lower, care of dangerously low inflation levels and a Federal Reserve, headed by Ben Bernanke, that was keeping its foot on the quantitative easing program. This year, inflation remains a key concern, and with the Fed no longer buying billions of Treasuries monthly, investors and credit traders are determining the yields.
S&P 500 June-December 2011: Stocks Plunge Following Standard & Poor’s Debt Downgrade
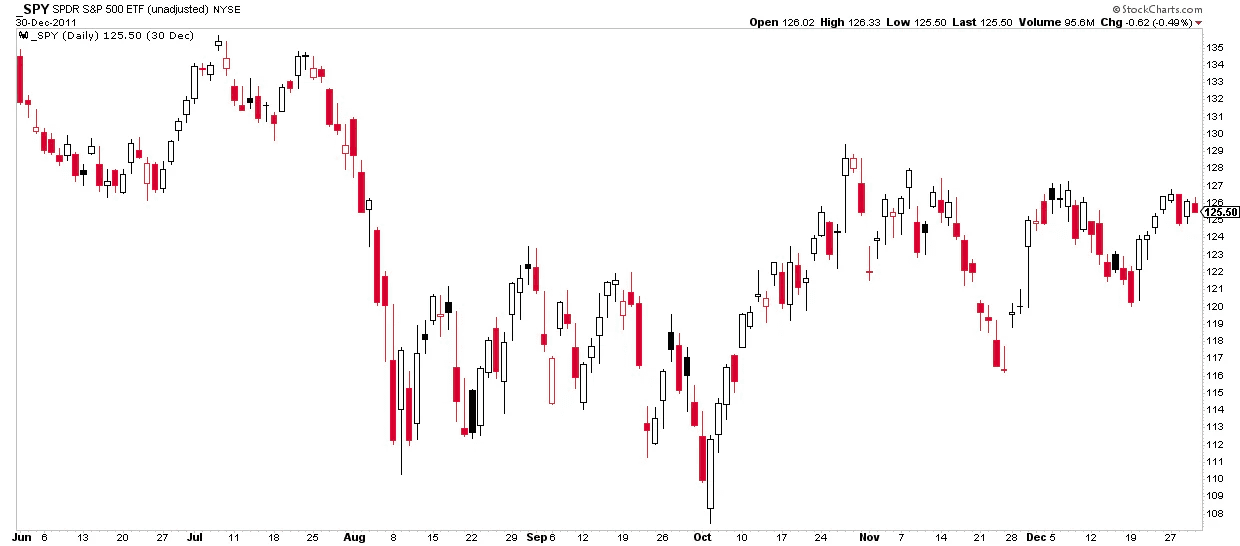
Source: Stockcharts.com
Bond Market Angst and Policy Changes Abroad
With that in mind, the risk is that more debt will have to be issued for the government to fulfill its obligations. Finance 101 says more supply means lower prices (hence, loftier yields).
And it’s not just a US phenomenon. We’ve talked about what’s happening in Japan. The Bank of Japan (BoJ) recently lifted its controversial yield curve controls (YCC) measures as its policymakers aim for a higher inflation rate.
Then go back in time – not 12 years ago, but less than 12 months ago: The Bank of England (BoE) encountered its own fiscal and monetary troubles when asset-liability mismatches among pension programs in the nation resulted in the forced selling of “gilts” (the English version of Long Bonds). The BoE had to step in and better coordinate with those in charge of fiscal matters to prevent further pension panic.
Could an Uneasy Macro Situation Threaten “Goldilocks”?
Now you can see how all of these macro matters are intertwined. One hiccup can lead to a systemic disease, and seemingly safe assets and sound policies can quickly come undone. Are we, then, on the precipice of global turmoil across the stock and bond markets? That’s unlikely, but you cannot rule anything out. Moreover, with a muted volatility Index and all this talk of a “goldilocks” economic outcome, few market participants are positioned for a rocky rest of Q3 and end of the year.
Wall Street Strategists Give In
Last week, our Alpha report underscored that we might indeed have reached Peak Goldilocks. The soft-landing, or no-landing, narrative had been baked in with steadily rising stock prices and Treasury rates that were merely inching higher on the expectation for better GDP growth ahead.
Sure enough, you can count on sell-side Wall Street strategists to turn bullish only after a massive rally in stocks. We have seen a host of forecasts from the Street turn more sanguine, capitulating to the bullish sway of the crowd. Higher S&P 500 earnings forecasts and a lifting of year-end price targets have been commonplace since late July.
More Boon Times for Commodities
But could the “experts” be wrong? And what could disrupt this year’s remarkably – dare we say “Magnificent” – bull market? Commodities. This is another topic we’ve been slowly commenting more on as the summer has progressed.
Last week, WTI crude oil settled at its highest price in almost four months. Gasoline futures, meanwhile, snuck a peek at the $3 mark at times but ended Friday near $2.80. Tack on about 95 cents to the prompt-month price of gasoline futures to arrive at the expected nationwide retail pump price - $4 per gallon is not too far away perhaps.
Oil Prices Rally Hard Since Late May
Source: TradingView
Dollar Jumps Post-Downgrade, Retreats After Friday’s Jobs Report
Making the 30% oil boost all the more impressive is that the latest thrust comes amid a strengthening dollar. The greenback dipped under 100 on the US Dollar Index a month ago but has since found its footing, finishing last week at 102. If we see any kind of weakness in the US currency as investors digest the Fitch downgrade, it could be off to the races across the commodity complex.
Of course, if the emergent optimistic outlook on the domestic economy doesn’t play out, or if Europe falls deeper into its economic rough patch, then demand for industrial commodities could wane. Also, recent data points out of China have been less than stellar.
“Better Than Feared” At Home
But domestic data has been solid, there’s no getting around that reality. The Citigroup Economic Surprise Index (CESI) climbed to its best reading since early 2021 last week. Back out the wild times around COVID-19, and the CESI is just about at its highest measures seen since the early 2000s. Despite both manufacturing and services soft data being just so-so, per recent ISM and PMI reports, and last Friday’s jobs report modestly missing the mark, most hard data has been resilient.
Last week, along with encouraging construction spending figures for June and healthy auto sales, key employment gauges were mixed but not too far from expectations. The first few days of each month feature updates from the Challenger Gray Job Cuts report, the Job Openings and Labor Turnover Survey (JOLTS), ADP private payrolls change, and the official Department of Labor employment situation.
Taking a holistic perspective, it was interesting that the Challenger report featured the fewest job cuts since August of last year – the first year-on-year decline in more than 12 months. Then, ADP suggested that private employers added jobs at a fast pace last month. In fact, this past June and July represented the best two-month labor market growth since Q2 of 2022, per ADP.
Finally, the government’s July jobs tally came in a smidgen lighter than the consensus forecast, but it was a generally in-line report – that came after a soft JOLTS number that noted fewer job openings in June compared to May.
US Jobs Cuts: Fewest Since August 2023, Per Challenger, Gray and Christmas

Source: Trading Economics
Lastly, from an investor’s point of view, markets have turned trickier. Given the Treasury market’s gyrations over the past few months and stocks that have been losing momentum, we’re back to the 2022 playbook of equities and intermediate-term Treasuries trading together – there’s scant diversification benefit. That makes taking an active approach with a keen eye on the macro all the more important as we venture further into the often-volatile back half of Q3.
Higher Yields, Lower Stocks

Source: BofA Global Research
The Bottom Line
Fitch’s move to strip the US of its AAA credit rating underscores long-term challenges policymakers in DC will encounter when it comes to fiscal policy. That, in turn, makes the Fed’s job more difficult. The era of easy money is clearly over while Congress’s disregard for keeping a sound budget may be coming home to roost.
Investors, however, must understand that corporations are rather savvy when it comes to focusing on turning profits for their shareholders. As we watch what unfolds, our team of macro hedge fund veterans will continue to position portfolios for new threats to global markets.
Want access to your own expert-managed investment portfolio? Download Allio in the app store today!
Related Articles


The articles and customer support materials available on this property by Allio are educational only and not investment or tax advice.
If not otherwise specified above, this page contains original content by Allio Advisors LLC. This content is for general informational purposes only.
The information provided should be used at your own risk.
The original content provided here by Allio should not be construed as personal financial planning, tax, or financial advice. Whether an article, FAQ, customer support collateral, or interactive calculator, all original content by Allio is only for general informational purposes.
While we do our utmost to present fair, accurate reporting and analysis, Allio offers no warranties about the accuracy or completeness of the information contained in the published articles. Please pay attention to the original publication date and last updated date of each article. Allio offers no guarantee that it will update its articles after the date they were posted with subsequent developments of any kind, including, but not limited to, any subsequent changes in the relevant laws and regulations.
Any links provided to other websites are offered as a matter of convenience and are not intended to imply that Allio or its writers endorse, sponsor, promote, and/or are affiliated with the owners of or participants in those sites, or endorses any information contained on those sites, unless expressly stated otherwise.
Allio may publish content that has been created by affiliated or unaffiliated contributors, who may include employees, other financial advisors, third-party authors who are paid a fee by Allio, or other parties. Unless otherwise noted, the content of such posts does not necessarily represent the actual views or opinions of Allio or any of its officers, directors, or employees. The opinions expressed by guest writers and/or article sources/interviewees are strictly their own and do not necessarily represent those of Allio.
For content involving investments or securities, you should know that investing in securities involves risks, and there is always the potential of losing money when you invest in securities. Before investing, consider your investment objectives and Allio's charges and expenses. Past performance does not guarantee future results, and the likelihood of investment outcomes are hypothetical in nature. This page is not an offer, solicitation of an offer, or advice to buy or sell securities in jurisdictions where Allio Advisors is not registered.
For content related to taxes, you should know that you should not rely on the information as tax advice. Articles or FAQs do not constitute a tax opinion and are not intended or written to be used, nor can they be used, by any taxpayer for the purpose of avoiding penalties that may be imposed on the taxpayer.