Updated August 1, 2023

Raymond Micaletti, Ph.D.
Macro Money Monitor
Market Recap
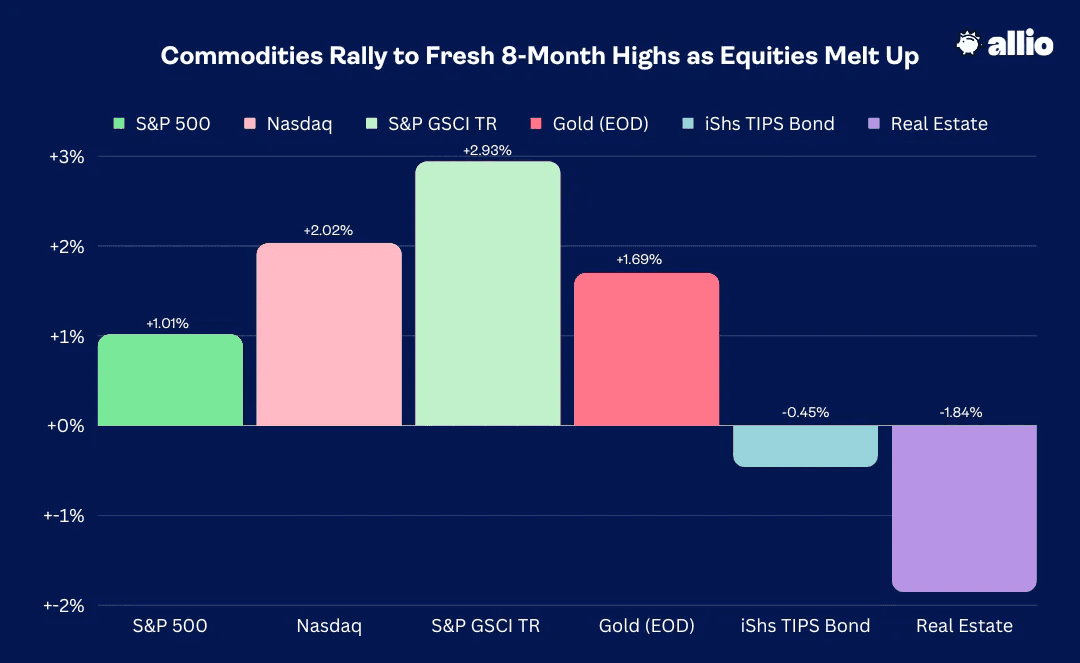
Stocks posted their third straight week of gains as the summer rally rolls on, though Thursday featured a jump in volatility amid key macro happenings. The S&P 500 closed at 4582, up better than 1% while the tech-led NASDAQ Composite’s advance was precisely double that of the SPX. Real Estate had been a hot sector for much of July, but it along with Utilities, was the worst niche among large caps last week.
Bond prices came under pressure amid sanguine economic growth data points and a poor Treasury auction on Thursday. The broad bond market dropped more than half a percentage point while inflation-protected fixed income gave back about the same. The big winner during the final full trading week of July was the commodities group as oil prices climbed above $80 for the first time in more than three months. Gold, meanwhile, snuck a peek above $2,000.
July 21, 2023 - July 28, 2023
The Look Ahead
The heart of earnings season continues this week with the final two ‘Magnificent Seven’ companies reporting second-quarter earnings; Apple and Amazon results come Thursday after the bell. Other big names with macro implications posting profit numbers include Toyota, Caterpillar, BP, Starbucks, Siemens, Qualcomm, ConocoPhillips, and Kellogg’s.
Data-wise, the July jobs report is top of the stack, which of course comes at 8:30 a.m. ET Friday while the key ISM Manufacturing index hits at its usual time – the first of the month at 10 a.m. ET. Also keep your eyes on the slew of auto sales reports to be released throughout the day on Tuesday (June featured a sequential pickup on vehicle sales).
Immaculate Disinflation?
Driving stocks higher last week (and keeping them resilient during a short-lived bout of volatility) was the growing narrative that short-term inflation trends are clearly on the mend. Thursday and Friday featured a bevy of major growth and consumer price data points. The headline story was surely about how strong Q2 GDP verified compared to expectations, but what helped catalyze a broader recovery and rally in equities on Friday was the bullish mosaic of inflation trends easing.
The GDP Price Index that crossed the wires was light at just 2.2% compared to the 3.0% survey figure. Core Personal Consumption Expenditure (PCE), the Fed’s preferred measure of inflation, rose 3.8% on an annualized quarterly basis, also softer than what economists were expecting.
Q2 US Core PCE: 3.8% Y/Y, Lowest Since Q1 2021

Source: Trading Economics
June Consumer Trends: Strong Spending on Less-Impressive Income Gains
Then on Friday, the personal income and outlays report revealed that income came in light while spending was a touch higher than the consensus. While the PCE Core Deflator matched expectations on a monthly basis, the year-on-year rate was a tick cooler than forecasted. Finally, consumers' view of the economy, not surprisingly, turned more rosy given the slowdown in the pace of rising costs for goods and services.
July’s Consumer Confidence report issued by The Conference Board notched a two-year high at 117 compared to the 112 expected number and June’s tally of 110.1. Both households’ feelings about the present situation and future expectations were strong. Jump ahead to Friday, and the July Final University of Michigan Consumer Sentiment data was revised down from its preliminary reading of 72.6, but 71.6 was still good enough for its highest reading since October 2021 amid a slowdown among inflation trends and a continued robust jobs market.
US Consumer Confidence: Highest Level since July 2021, Second Straight Monthly Climb
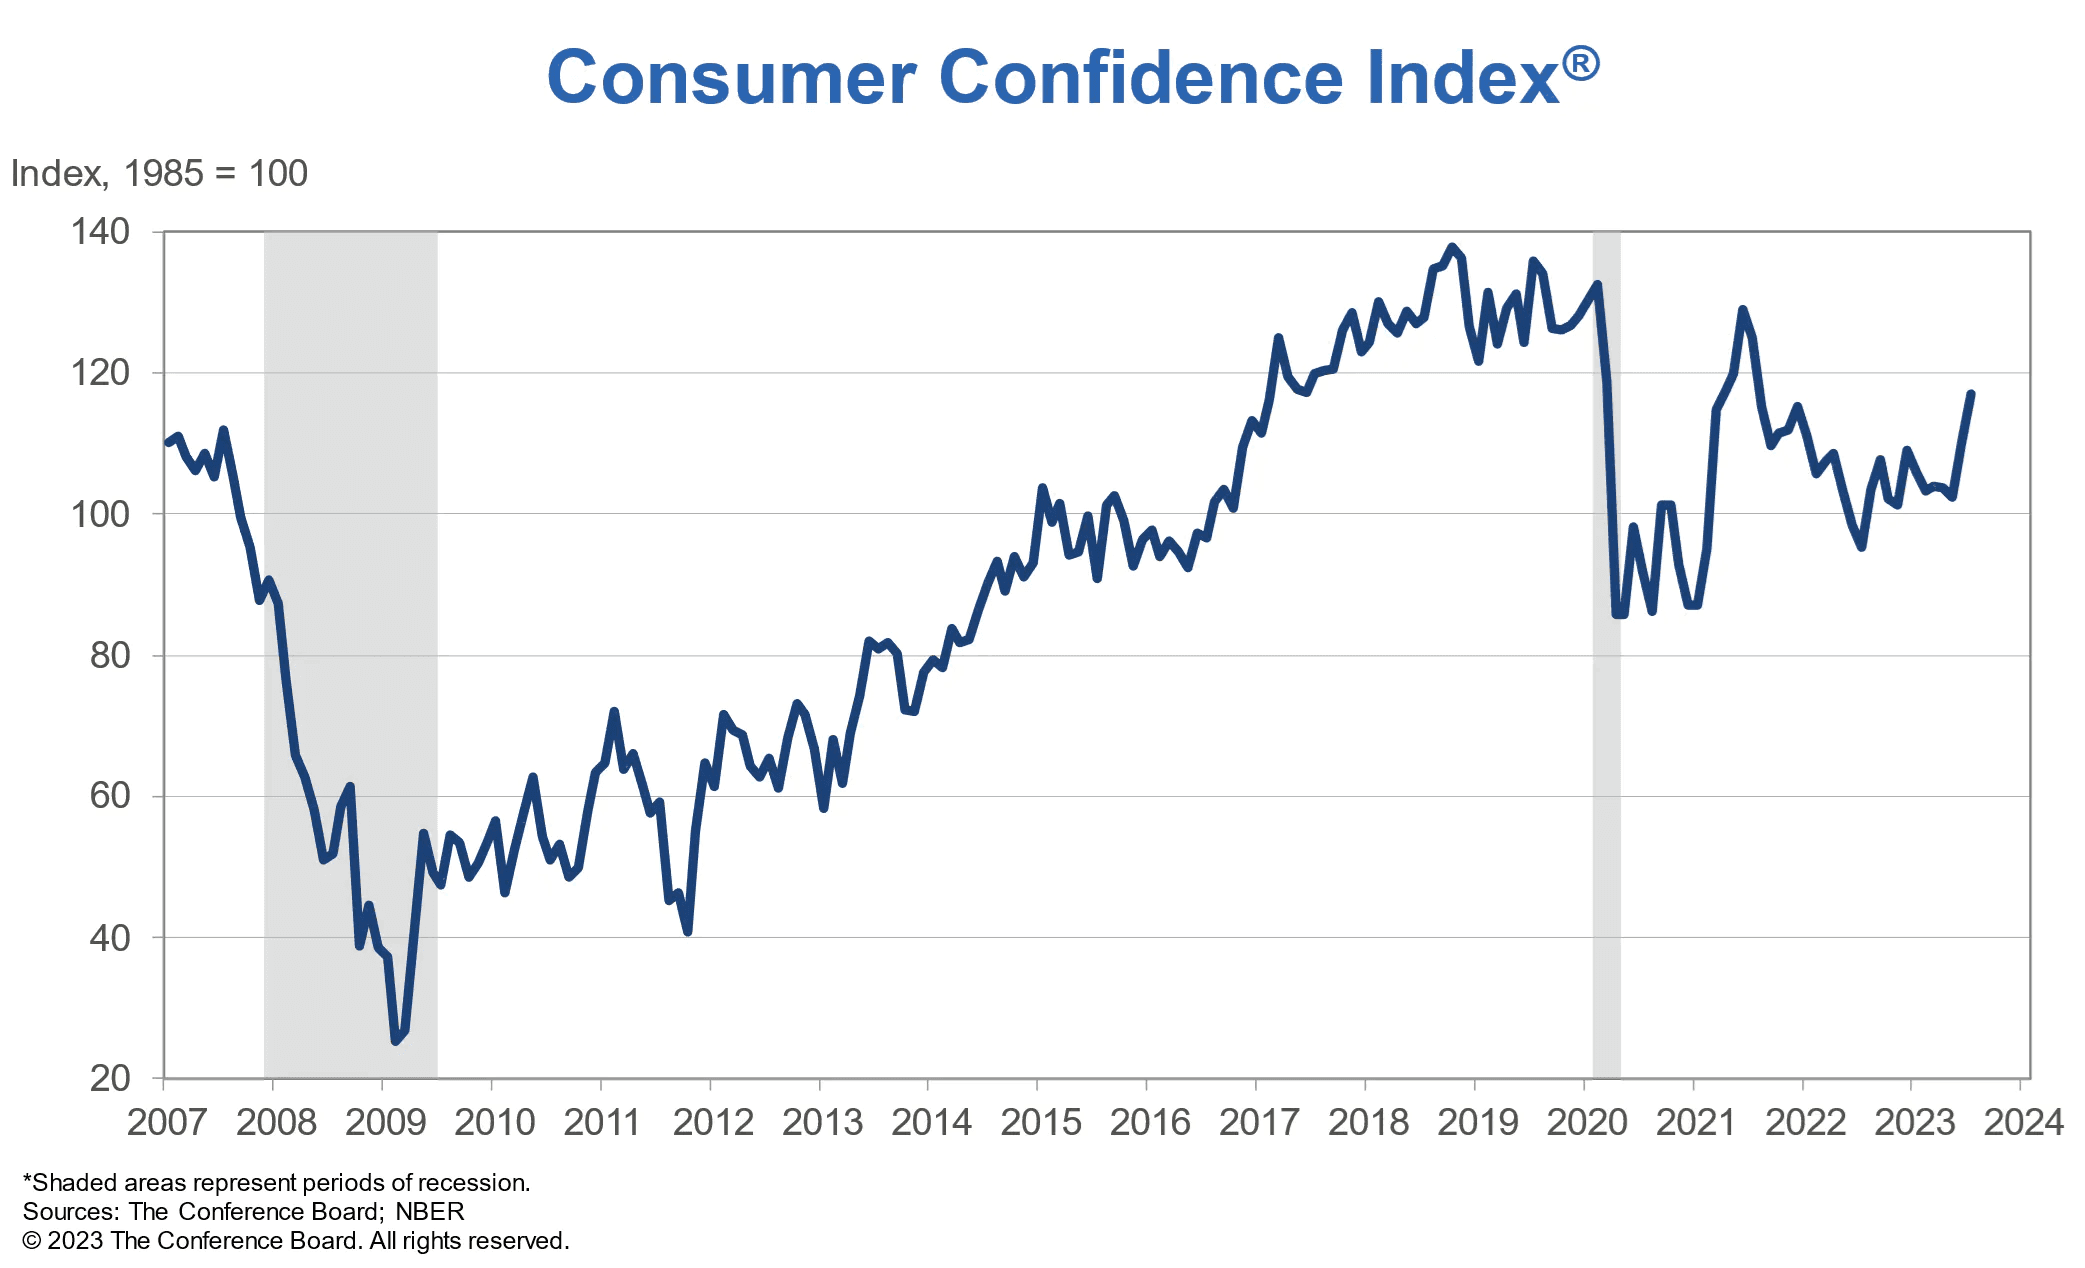
Source: The Conference Board
Growth Pulse Check: Strong Services, Weak Manufacturing
On the growth side of the ledger, July appears to have been robust from a payrolls perspective and when assessing the services sector, helping to auger robust consumer spending more recently. Manufacturing, meanwhile, looks quite soft. Yet another sub-50 ISM Manufacturing figure is expected come Tuesday morning this week as all the key regional Fed gauges released through last Friday showed a negative monthly change. BofA’s tracker portends a ninth consecutive contractionary ISM Manufacturing PMI, and if 45.8 verifies, that would be the weakest print since May 2020.
Regional Fed Surveys Suggest a Poor ISM Manufacturing Print on Tap for July
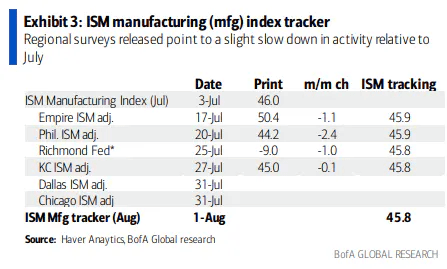
Source: BofA Global Research
GDP Growth Tops Wall Street Forecasts. The Recession that Just Won’t Come.
Of course, the US economy is driven not by manufacturing alone, but also by consumer spending. Moreover, we are a services-based growth engine. Thus, even with a tepid manufacturing situation, GDP growth has remained firm care of consumers doing what they do best: spending. While Johnson Redbook weekly sales data shows slightly lower retail spending recently compared with a year ago, rising inflation-adjusted wages and still-strong travel activity helped buoy the economy last quarter.
Impressive Growth Lately, But Challenges Ahead
According to the Bureau of Economic Analysis, the advance read on second-quarter GDP came in at +2.4%, much stronger than the 1.8% consensus. Indeed, personal consumption was stout over the April through June period while the business investment component was also much better than feared. Housing was once again a detractor while net exports were negative, dinging growth in the quarter. This was a hot data point that helped send Treasury yields higher on Thursday.
As so many Wall Street economists had predicted the first half of 2023 to be a rough patch, even recessionary, Q1 real GDP is now seen as having come in at +2.0% while Q2 featured a slight acceleration in activity. Then on Friday, market pundits turned giddy around a first look at the Atlanta Fed’s GDPnow tracker which unveiled an initial estimate of +3.5%. We must caution, though, that this is just a model using data that has been released (which is scant for Q3 so far). The consensus is for growth of under 1% on an annualized basis this quarter.
3.5% Q3 real GDP Growth? Simmer Down Now.

Source: Atlanta Federal Reserve
Are Higher Mortgage Rates Leading to Higher Home Values?
To say there were a lot of key economic data points last week is an understatement. We also got a May view of the domestic housing market via the Case-Shiller Home Price Index which showed a soft 0.5% decline in its 20-city composite. There are signs that home values are on the rise when analyzing more real-time high-frequency data while rental prices are on the rebound. All this despite mortgage rates climbing above 7% once again. Although, the higher mortgage rates are, the less existing supply is likely to come onto the market since current homeowners are stuck with golden handcuffs on in the form of sub-3% mortgages.
Enter: The Wealth Effect
Along with higher stock prices this year, a slight uptick in real estate values helps to stir up bullish impacts from what’s known as the “wealth effect” which posits that when folks feel like they are worth more (via higher asset values and income), then they are wont to spend more aggressively, furthering a bullish (and potentially inflationary) cycle.
Of course, a slowing employment market could halt that notion rather quickly – we'll get an update on the jobs situation later this week. While new home sales came in softer than expected on Thursday, initial jobless claims were to the good side. At just 221,000, it was the lowest amount in five months and sharply below the +235,000-consensus forecast. Continuing claims also dipped to notch its lowest level since January, suggesting that jobseekers can quickly find new work.
Initial Jobless Claims: Fresh 5-Month Low

Source: St. Louis Federal Reserve
Hard Data > Vibes
In terms of business investment and industrial activity trends, the Durable Goods Orders report was another key indicator last week. At +4.7% month-over-month for June, it was the steepest rise since July 2020, and that followed an upwardly revised 2% May increase. Durable Goods ex-Transportation also came in strong at +0.6%. So, while the manufacturing sector’s vibes remain weak (according to regional ISM survey data), hard data suggests solid growth realities.
So, What About That Fed Meeting?
That brings us to the Fed. Last Wednesday’s quarter-point rate hike announcement was exactly what investors and strategists were looking for. Also, Chairman Jay Powell’s afternoon press conference was maybe his best one so far. He relayed to the market that the Federal Open Market Committee (FOMC) would be closely watching how new data points came in between now and their September meeting. The Fed remains suggestive that one or two hikes might still be needed, while bond traders have priced in about a one-in-three chance of a final rate hike, perhaps coming at the November meeting.
Getting to 2% Inflation Will be Tricky
The Fed is getting what it wants, but it won’t say that so much. With Headline CPI now at 3%, its dual mandate of promoting maximum employment along with maintaining price stability is closer to being achieved. As we mentioned last week, however, bringing inflation from 3% to 2% is a tall order given such apparent strength in the underlying economy. It had appeared that data was turning a bit weak earlier in July, but that might have just been a short-term blip. We’ll know more by the close of this week.
Oil Tops $80, US Gas Prices May Approach $4/Gallon Once Again
Also tossing a possible wrench in the FOMC’s second-half plans is price action across the board in commodities. Led by gains in global oil prices, the S&P GSCI Commodity Index (GTX) finished last week at its highest level since November 2022. What's more concerning is that raw material costs are escalating precisely when we are cycling off the peak commodity prices from the last year, such as the oil high in June 2022, nearing $130 per barrel.
Moreover, the sustained growth in wages amid the backdrop of higher energy, agricultural, and metals prices may compel the Fed to continue raising interest rates and maintain a high policy rate for an extended period. Many indications are pointing towards the likelihood of inflation remaining uncomfortably high in the upcoming quarters and years compared to the relatively low inflation rates of the 2010s.
Commodities Creep Up to 8-Month Highs

Source: Stockcharts.com
Japan Losing its Policy Grip, Macro Implications
There were key developments overseas, too. The Bank of Japan eased on its yield curve control measures, allowing for a higher inflation target in an announcement on Thursday. That’s key because it could make Japanese Government Bonds (JGBs) more attractive to global investors compared to US Treasury securities. As a result, domestic bond yields rose big that afternoon which, along with poor demand in a Treasury auction, send the 10-year yield up from 3.85% at the mid-week low to 4.02% before the week’s settle at 3.97%.
The Bottom Line
The summer rally lives on, but volatility began to surface at times last week. Positive signs on the inflation front along with robust growth numbers suggest a goldilocks economic outcome, but rising commodity prices and bond yields creeping up suggest the Fed may have to be more aggressive not only over the back half of this year but perhaps through the election period.
It only solidifies our ongoing stance that an inflation resurgence may be a long-term headwind for markets. Near-term, though, as solid earnings data continues to hit the tape, corporations appear to be juggling so many macro crosscurrents well. More major data comes this week with ISM Manufacturing on Tuesday and the big July jobs report on Friday.
Want access to your own expert-managed investment portfolio? Download Allio in the app store today!
Related Articles


The articles and customer support materials available on this property by Allio are educational only and not investment or tax advice.
If not otherwise specified above, this page contains original content by Allio Advisors LLC. This content is for general informational purposes only.
The information provided should be used at your own risk.
The original content provided here by Allio should not be construed as personal financial planning, tax, or financial advice. Whether an article, FAQ, customer support collateral, or interactive calculator, all original content by Allio is only for general informational purposes.
While we do our utmost to present fair, accurate reporting and analysis, Allio offers no warranties about the accuracy or completeness of the information contained in the published articles. Please pay attention to the original publication date and last updated date of each article. Allio offers no guarantee that it will update its articles after the date they were posted with subsequent developments of any kind, including, but not limited to, any subsequent changes in the relevant laws and regulations.
Any links provided to other websites are offered as a matter of convenience and are not intended to imply that Allio or its writers endorse, sponsor, promote, and/or are affiliated with the owners of or participants in those sites, or endorses any information contained on those sites, unless expressly stated otherwise.
Allio may publish content that has been created by affiliated or unaffiliated contributors, who may include employees, other financial advisors, third-party authors who are paid a fee by Allio, or other parties. Unless otherwise noted, the content of such posts does not necessarily represent the actual views or opinions of Allio or any of its officers, directors, or employees. The opinions expressed by guest writers and/or article sources/interviewees are strictly their own and do not necessarily represent those of Allio.
For content involving investments or securities, you should know that investing in securities involves risks, and there is always the potential of losing money when you invest in securities. Before investing, consider your investment objectives and Allio's charges and expenses. Past performance does not guarantee future results, and the likelihood of investment outcomes are hypothetical in nature. This page is not an offer, solicitation of an offer, or advice to buy or sell securities in jurisdictions where Allio Advisors is not registered.
For content related to taxes, you should know that you should not rely on the information as tax advice. Articles or FAQs do not constitute a tax opinion and are not intended or written to be used, nor can they be used, by any taxpayer for the purpose of avoiding penalties that may be imposed on the taxpayer.