Updated June 13, 2023

Raymond Micaletti, Ph.D.
Macro Money Monitor
Market Recap
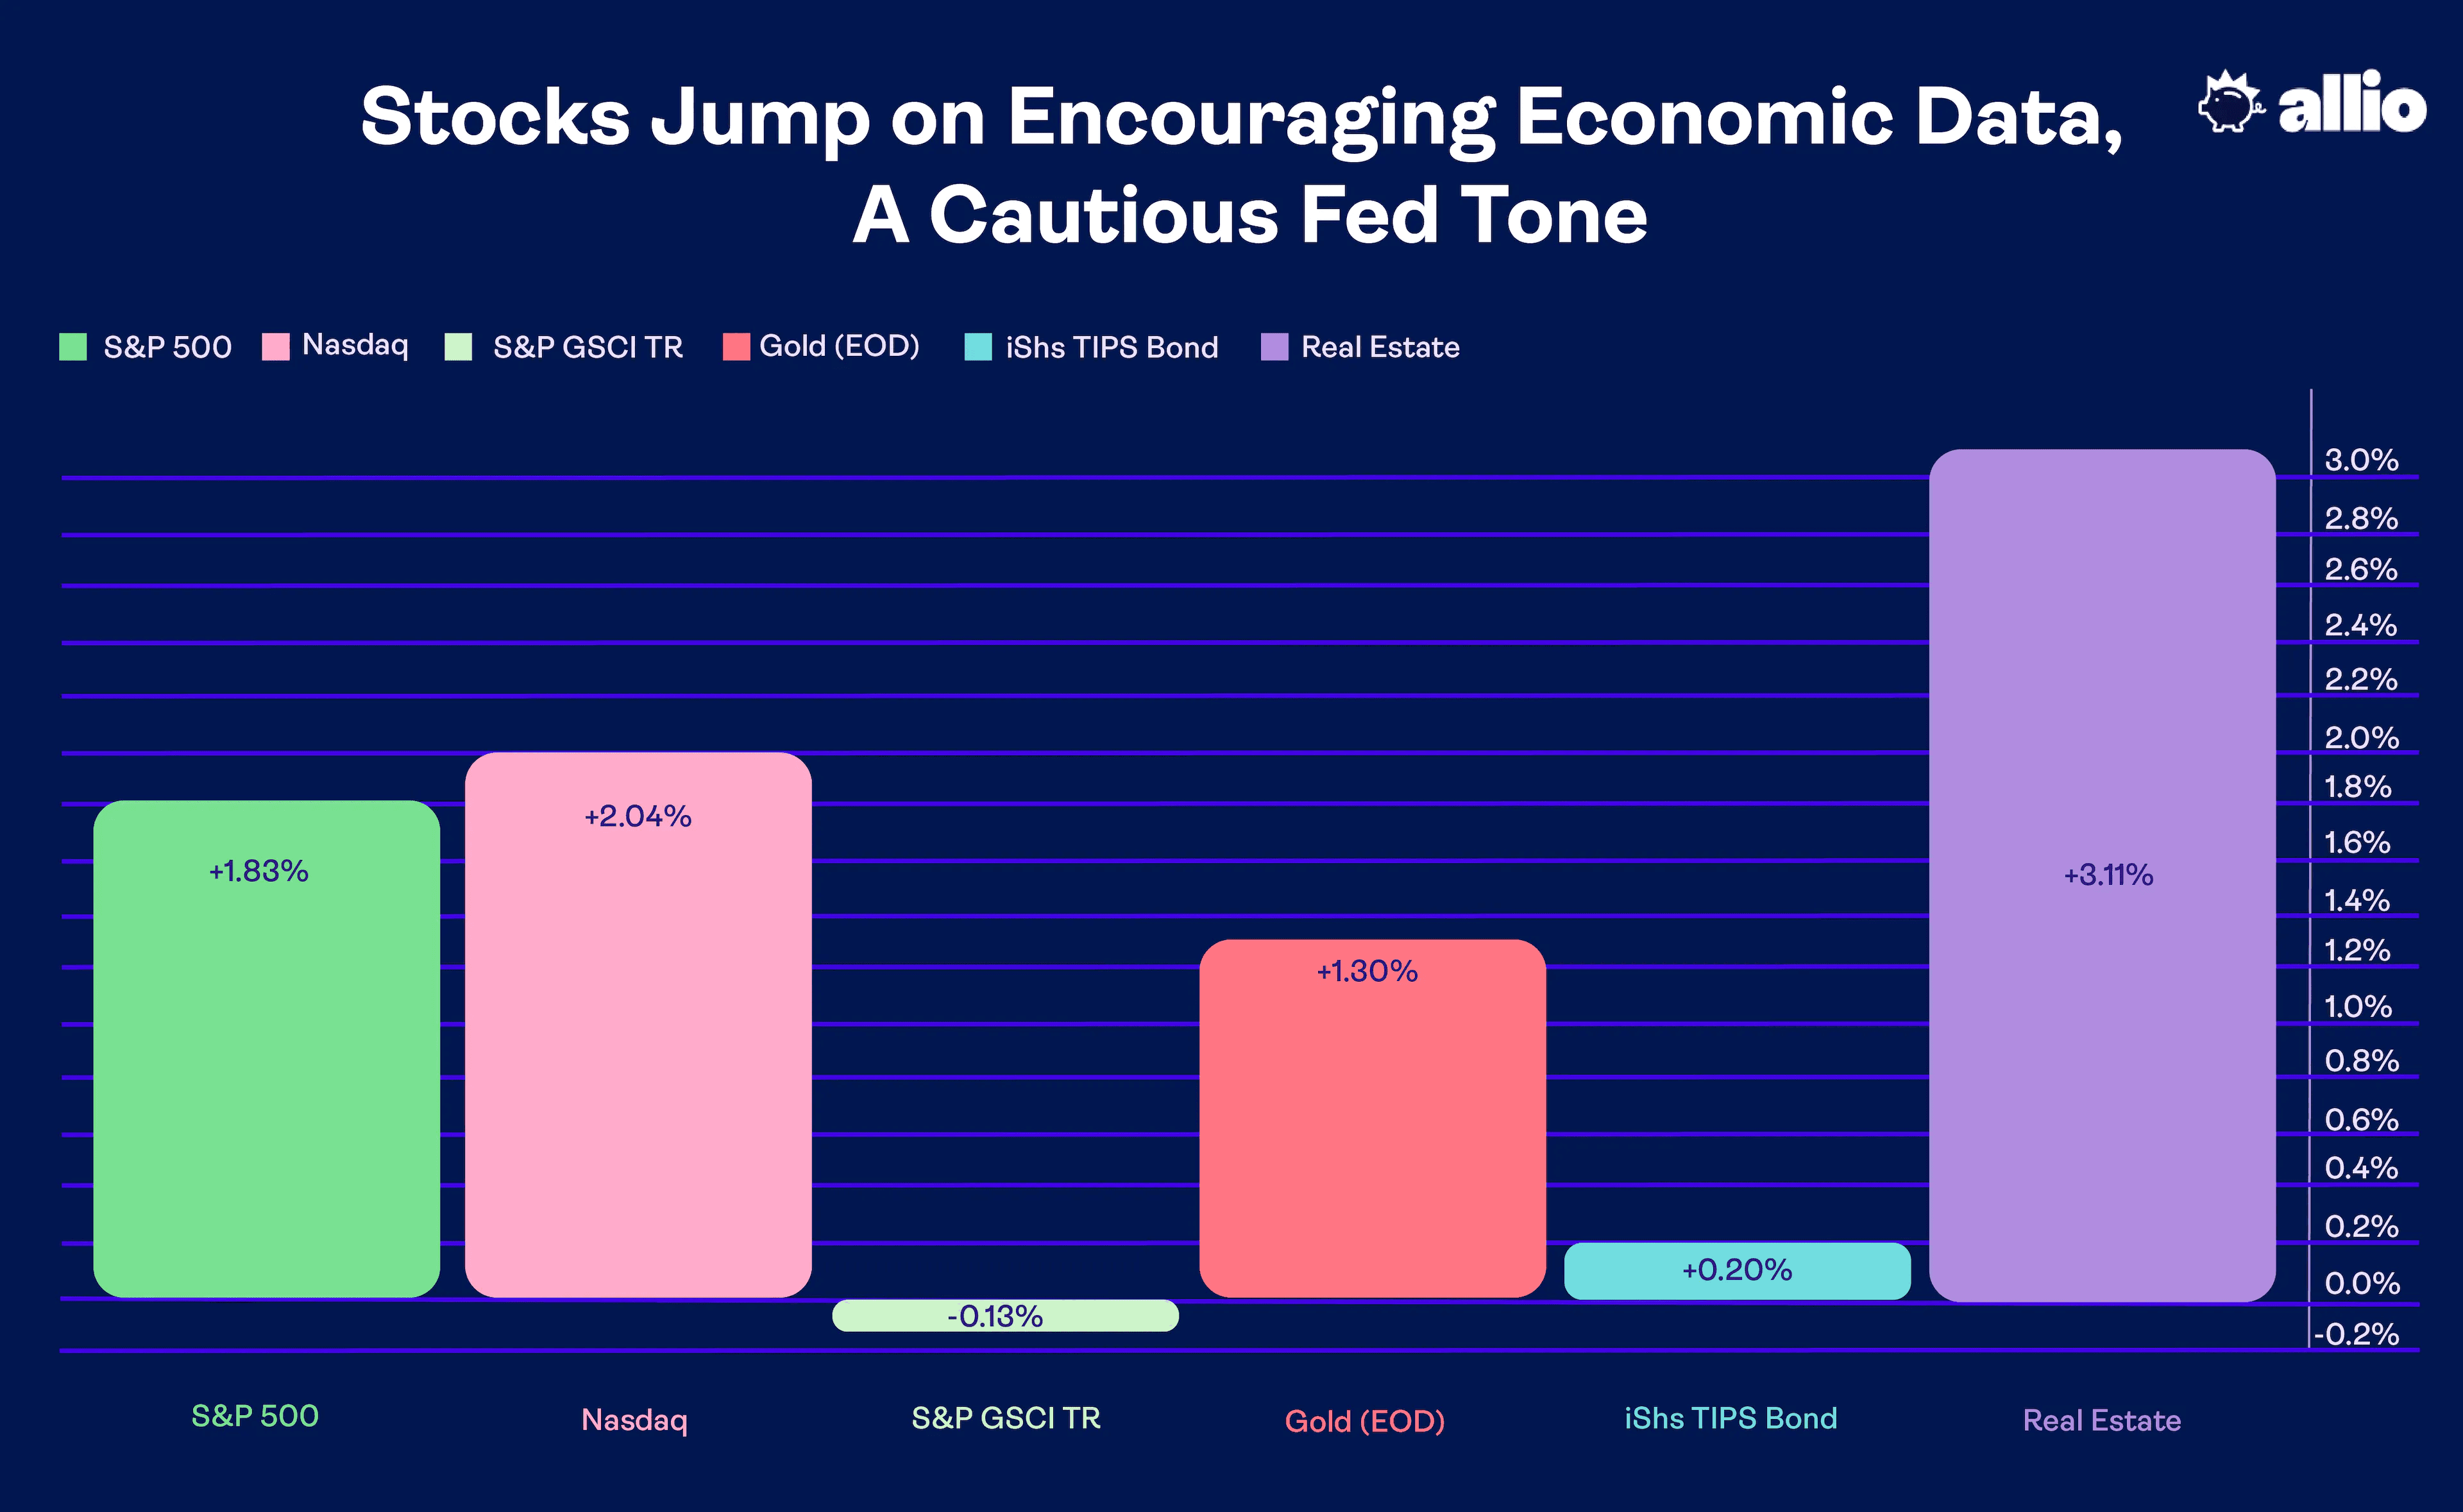
The S&P 500 logged a solid 1.8% advance during the holiday-shortened week. The gains were focused on the first pair of trading days in June, though. Thursday and Friday featured positive reactions across sectors and market caps as generally goldilocks economic data crossed the wires. The NASDAQ Composite outperformed slightly, rising 2% for its sixth-straight week of gains, its best winning streak since early 2020.
Elsewhere, commodities continued to sag with the S&P GSCI index posting a fractional loss as the US Dollar Index continued to perform well. Gold, on the other hand, caught a bid after a lackluster back half of May.
In the bond market, yields had a topsy-turvy week considering that disaster was averted in DC following the debt ceiling deal, then strong economic data moved markets late last week. In the end, Treasuries finished with slight gains, helping TIPS to sport a 0.2% climb. Real Estate, a key sector right now considering uncertainty in commercial property, rose big to notch its best week since March.
May 26, 2023 - June 2, 2023
The Jobs Market Hums Along
Last week, we underscored how pivotal the final few days of May and the first two sessions of June would be. A slew of key employment data for both April and May would likely dictate how the Federal Reserve may conduct monetary policy at both the June 14 and July 26 FOMC meetings. Survey says: The jobs market remains strong.
In Focus: Surprising Strength in Real Estate
Let’s take a moment, catch our breath, and level set where things stand in the macroeconomy. We will get to the employment situation in a moment, but there is an intriguing trend emerging in the US housing market.
Last Tuesday, before stocks opened for trading, the March S&P Case-Shiller Home Price Index hit the tape. With a 0.7% year-on-year climb, it was largely better than estimates. Now, this is data for March, so it is quite lagging, but it appears home values are stabilizing and even back on the rise. The real estate rebound makes real-time inflationary trends a bit more skewed to the upside. This is something to watch ahead of the CPI report due out on June 13 – day one of the Fed’s meeting this month.
US Home Values Back on the Rise

Source: St. Louis Federal Reserve
But we can’t talk about home price trends without mentioning what is happening in the rental market. What’s great about today’s world of high-frequency data and boot-on-the-ground reporting is that we can use up-to-date information from outlets like Apartment List to see what young people are doling out to landlords each month.
After a notable decline in the monthly National Rent Index from September 2022 through this past January, there have been four consecutive increases. It is another sign that the real estate downturn is, at the very least, troughing.
National Rental Market Posts Four Monthly Price Climbs

Source: Apartment List
But there’s a wrench in this sanguine story: mortgage rates. With Treasury prices dipping in May, interest rates were on the rebound. The benchmark 10-year yield jumped from a low of under 3.3% a month ago to approach 4% near the end of May. While bond buyers stepped in to send the key rate back down into the mid-3s, the current 3.69% level keeps 30-year fixed rate mortgage rates very high compared to recent history.
Baby Boomers can recall paying 10%-plus to lock in a home loan, but Millennials and Gen Z face a double-whammy of rising prices (on top of an already expensive housing market) and borrowing rates close to 20-year highs. The result? Awful affordability for first-time buyers.
US 10-Year Yield Jumps in May, Keeping Mortgage Rates High

Source: Stockcharts.com
There’s an index to track everything in the financial markets. One of our favorites is the National Association of Realtors’ Housing Affordability Index. (And it tells a sobering story.) Marry higher home prices today versus late last year with the average 30-year mortgage rate being near 7%, and net affordability is in the toilet, to put it bluntly.
We will get a fresh read from the NAR this coming Friday for the month of April. But with an uptick from 6% back to 7% on conventional mortgage rates, affordability is pretty much near the worst levels dating back to the late 1980s.
Another key input into the Housing Affordability Index is how much homebuyers are earning. Wages and annual income play an underappreciated role. After all, if the unemployment rate is low and wage growth is comfortably above the pace of inflation, then no worries, right? That returns us to last Friday’s jobs report. You see how it all ties together? This is what we do every day at Allio – piecing all the macro parts of the puzzle together to build sturdy and durable portfolios with an eye on risk management.
Robust Employment Situation: What It Means for Markets
The May payrolls report was a doozy. At +339,000 net jobs created, it handily beat expectations that had called for just a 195,000 employment increase. What’s more, prior two-month revisions were to the good side by 93,000.
Last Wednesday’s ADP private sector payroll estimate turned out to be right in its call for healthy gains – the official survey from the government revealed a 283,000 payroll rise in that key part of the economy. May’s job gains were again focused in the education and health services areas while manufacturing employment suffered a modest contraction. The worst segment was the tech-dominated Information niche despite ebbing IT layoff announcements from the peak back in January.
Dig deeper, however, and we can spot potential bellwether labor market signs. For instance, take a look at the average hourly earnings figured (year-on-year) and the average weekly hours worked in the above graphic. Both came in a tad lighter than economists were expecting. Those appear to be modest misses, but in proper context, this made the Fed quite pleased. Given the size of the US labor force, just a one-tenth of a percentage point fall in hourly earnings coupled with a one-tenth of an hour worked fall off, and the net effect is comparable to losing about 450,000 jobs.
So, while it was a 14th straight better-than-expected monthly headline payrolls increase, there were some encouraging signs of loosening pressures in a tight labor market. And we cannot ignore the jump in the unemployment rate from 50-year lows of 3.4% to 3.655% (unrounded), as it was reported that a sizable chunk of self-employed workers re-entered the labor force seeking 9-5 work.
Recapping A Busy Week of Economic Reports
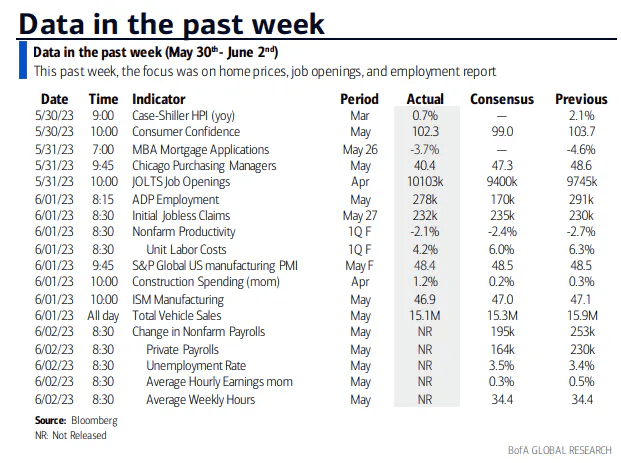
Source: BofA Global Research
Laying the Smackdown on Manufacturing
As the employment picture remains rosy for the most part, care of strong services demand, the manufacturing sector is stone cold. Next to the monthly NFP employment report and CPI inflation gauge, the ISM Manufacturing survey issued on the first trading day of each month is the most important barometer of economic activity.
It is a ‘diffusion index’ – that means there are several sub-components that form the composite figure. Also, it’s straightforward to interpret. Above 50 is seen as economic expansion while a sub-50 figure indicates contraction. For seven months in a row, the US manufacturing sector has been shrinking. Clearly in recession territory, last Thursday’s May figure of 46.9 on the ISM Manufacturing PMI drags on GDP growth right now.
As our macro puzzle comes together, the Fed decided to throw caution to the wind and send out two voting members to assuage market concerns of yet another rate hike at the FOMC gathering two weeks away. 2023 Fed Committee members Philip Jefferson and Tom Harker introduced the notion of a ‘skip,’ not a ‘pause,’ in the rate hiking campaign. The odds of a quarter-point increase dropped from about 75% to 25% as a result. But, as of last Friday, there remains a 68% probability of a hike at the late-July decision date.
Compared to today’s Fed Funds target range of 5% to 5.25%, the first net rate cut is not expected until perhaps January next year. Recall it was just two months ago, shortly after the regional banking crisis, that swifter easing to monetary policy was anticipated. Market conditions are fluid, though, and economic resiliency along with continued generally hawkish Fed jawboning has nixed expectations for rate cuts from the 2023 calendar.
Stocks Taking It All in Stride: Small Caps and Value Sectors Enter the Bullish Ring
And equities seem A-OK with that. The S&P 500 settled last week at its highest level since August 2022 while the NASDAQ Composite notched a 52-week high. Even the Russell 2000 small-cap index came rip-roaring back with its best two-day performance (Thursday and Friday) since November last year. Something we’ll be watching is for a summertime breadth improvement. That is technical talk for more widespread participation in the stock market’s rally.
The Irresistible Force of Big Tech & AI
It was just a week or two ago when the talk on the street was about how mega-cap tech was the only game in town. Shares of Meta Platforms (META) and NVIDIA (NVDA) had more than doubled. In fact, a new catchphrase emerged among analysts and market strategists. The “Magnificent Seven” stocks of Apple, Microsoft, Nvidia, Amazon, Meta, Tesla, and Alphabet (the moniker comes from the 2016 movie by the same name and the original 1960 American Western film) have been responsible for all the S&P 500 gains in 2023. Technical analysts want to see more stocks toss their hats in the bullish ring.
New Challengers Emerge to Take on Growth
Following the upbeat jobs report indicating economic strength, small-cap cyclical equities played catch up. The iShares Russell 2000 ETF (IWM) surged more than 3.6% for its best day since mid-November last year. Maybe more importantly, “the smalls” settled at fresh highs dating back to mid-March when the financial fallout took place.
We signaled caution regarding the euphoric tech and AI sentiment following NVDA’s blowout earnings report and stunning stock price reaction, and new leadership from the old-school value and cyclical sectors could take traders for a surprise. Just something to watch for now. Until we see more definitive signs that there’s a hand-off from growth to value, Allio’s portfolios remain in favor of the Nasdaq 100.
Russell 2000 Small-Cap ETF: Best 2-Day Performance in More Than 6 Months

Source: Stockcharts.com
Looking ahead, expect a quiet period before the Fed meeting begins on June 13 – that's also when CPI data for May hits. With the Volatility Index settling at its lowest mark since February 2020 and a dearth of data, earnings, and FedSpeak this week, it might be an ideal few days to hit the beach. A respite after the last two weeks of AI fervor and hurricane of economic readings has been earned.
The Bottom Line
The stock market rally broadened out beyond big tech to jumpstart June amid encouraging economic signs. An apparent recovery in the housing market lifted the Real Estate sector to impressive gains while Friday’s jobs report was exactly what the bulls were gunning for. With a ‘skip’ now in the cards at the next Fed gathering and a debt ceiling agreement reached, there are fewer near-term bearish catalysts.
Want access to your own expert-managed investment portfolio? Download Allio in the app store today!
Related Articles


The articles and customer support materials available on this property by Allio are educational only and not investment or tax advice.
If not otherwise specified above, this page contains original content by Allio Advisors LLC. This content is for general informational purposes only.
The information provided should be used at your own risk.
The original content provided here by Allio should not be construed as personal financial planning, tax, or financial advice. Whether an article, FAQ, customer support collateral, or interactive calculator, all original content by Allio is only for general informational purposes.
While we do our utmost to present fair, accurate reporting and analysis, Allio offers no warranties about the accuracy or completeness of the information contained in the published articles. Please pay attention to the original publication date and last updated date of each article. Allio offers no guarantee that it will update its articles after the date they were posted with subsequent developments of any kind, including, but not limited to, any subsequent changes in the relevant laws and regulations.
Any links provided to other websites are offered as a matter of convenience and are not intended to imply that Allio or its writers endorse, sponsor, promote, and/or are affiliated with the owners of or participants in those sites, or endorses any information contained on those sites, unless expressly stated otherwise.
Allio may publish content that has been created by affiliated or unaffiliated contributors, who may include employees, other financial advisors, third-party authors who are paid a fee by Allio, or other parties. Unless otherwise noted, the content of such posts does not necessarily represent the actual views or opinions of Allio or any of its officers, directors, or employees. The opinions expressed by guest writers and/or article sources/interviewees are strictly their own and do not necessarily represent those of Allio.
For content involving investments or securities, you should know that investing in securities involves risks, and there is always the potential of losing money when you invest in securities. Before investing, consider your investment objectives and Allio's charges and expenses. Past performance does not guarantee future results, and the likelihood of investment outcomes are hypothetical in nature. This page is not an offer, solicitation of an offer, or advice to buy or sell securities in jurisdictions where Allio Advisors is not registered.
For content related to taxes, you should know that you should not rely on the information as tax advice. Articles or FAQs do not constitute a tax opinion and are not intended or written to be used, nor can they be used, by any taxpayer for the purpose of avoiding penalties that may be imposed on the taxpayer.